Showing posts with label Jobs. Show all posts

Saturday, June 1, 2024

Soft Landing At Risk? Next Data Point -- May, 2024, BLS Unemployment -- Data Points Starting In May, 2024

Locator: 48021ECON.

Updates

June 13, 2024: soft landing at risk? Deflation?

June 7, 2024: joblesssness -- huge surprise; analysts can't explain it. JPow can take a sign of relief.

June 3, 2024: GDPNow -- drops to 1.8 from previous 2.7.

June 2, 2024: Carl Q tweeted again.


June 2, 2024: Carl Q sees the same thing I'm seeing. Actionable: JPow may be forced to act. "All eyes" on May's unemployment figures." Link here.

Original Post

It's very, very subtle, but there's just enough information coming out now suggesting that the economy is slowing down -- perhaps significantly -- JPow has to be a bit concerned. 

  • The next data point is this next Friday, the unemployment report.  U3 is at 3.9. A lot of Wall Street analysts are suggesting if Friday's unemployment number has a "4-handle," it's time for the Fed to take note. Friday: 6, 2024, the May, 2024, data.
  • May, 2024, unemployment data -- three possibilities: no change, up, down. My bet:
    • no change (stays at 3.9): 40% chance / likelihood
    • 4-handle: 30% chance / likelihood
    • 3.7: 20% ditto
    • 3.8: 10% ditto

Pending house sales, April, 2024.

  • analysts estimate: down 0.7%.
  • actual: down 7.7%
  • holy mackerel.

New automobile glut? Link here. New car prices are going to have to start coming down. The MRSP won't drop, but the actual price paid / financing will have to come down.

A dropping GDP and the following graph should be very, very concerning, link here:

****************************
On The Other Hand

Air travel in the US surging; globally will finally beat 2019 data.

US gasoline demand starting to surge.

Saturday, November 4, 2023

Friday, July 8, 2022

Probaby Needs To Be Fact-Checked -- July 8, 2022

Link here. And apparently wage pressure is not particularly noteworthy.

A very, very strange recession, indeed.


One can only assume it's all that stimulus money since 2020 that is still working its way thorough the economy.

Jobs: Wow, Wow, Wow -- Exceeds Expectations -- Not Stagflation, Yet -- July 8, 2022

Jobs report: expectations and analysis. The WSJ. Before the numbers are reported.

Jobs, actual: 372,000! Wow, wow, wow.
  • Link here.
  • Market will collapse. Put more pressure on Fed to keep raising rates.
  • Participation rate: pretty much unchanged, around 62%.
  • Interest rate has moved up. Ten-year treasury at 3.07% yield.  
  • Unemployment rate stays unchanged at 3.6%. 
  • Steve Liesman does not see report at inflationary.
    • "some recession that we're having" (agree completely)
    • a recession with 3.6% unemployment and 372,000 jobs added? 
    • certainly not stagflation yet
    • suddenly not worried about recession 

Re-posting from July 6, 2022

US recession: unfortunately for most, this article is behind a paywall.

  • it's a very, very long article
  • written by one of the better WSJ analysts; generally doesn't write but rather edits
  • "If the US is in a recession, it's a very strange one."

The U.S. economy has experienced 12 recessions since World War II, and each one included two features: Economic output contracted and unemployment rose.

Today, something highly unusual is happening. Economic output fell in the first quarter and signs suggest it did so again in the second. Yet the job market showed little sign of faltering during the first half of the year. The jobless rate fell from 4% last December to 3.6% in May.

It is the latest strange twist in the odd trajectory of the pandemic economy, and a riddle for those contemplating a recession. If the U.S. is in or near one, it doesn’t yet look like any other on record.

Analysts sometimes talked about “jobless recoveries” after past recessions, in which economic output rose but employers kept shedding workers. The first half of 2022 was the mirror image—a “jobful” downturn, in which output fell and companies kept hiring. Whether it will spiral into a fuller and deeper recession isn’t known, though a growing number of economists believe it will.

Krugman: Paul -- also doesn't see definition of stagflation holding up which requires a high unemployment rate, and the 10-year Treasury yield is falling. Fast. Today: the yield is below 2.8% -- at 2.794% -- recall: 3% yield for the TYT is the threshold for disaster -- CNBC talking heads.

Krugman posted a FRED graph to support his case. I won't post the link; not worth the time. But six months to a year from now economists will declare a recession or not.

Jobs -- July 8, 2022

Jobs report: expectations and analysis. The WSJ. Before the numbers are reported.

Jobs, actual: 372,000! Wow, wow, wow.
  • Link here.
  • Market will collapse. Put more pressure on Fed to keep raising rates.
  • Participation rate: pretty much unchanged, around 62%.
  • Interest rate has moved up. Ten-year treasury at 3.07% yield.  
  • Unemployment rate stays unchanged at 3.6%. 
  • Steve Liesman does not see report at inflationary.
    • "some recession that we're having" (agree completely)
    • a recession with 3.6% unemployment and 372,000 jobs added? 
    • certainly not stagflation yet
    • suddenly not worried about recession

*******************************
Re-Posting

Re-posting, from May 19, 2022:

The numbers below refer to "jobless claims."

From May 19, 2022:

From May 15, 2022:

I remember doing the same back-of-the-envelope analysis in the early days of the blog and coming up with similar numbers. 

Link here. Or direct to paywalled MarketWatch

Friday, June 3, 2022

Jobs, Recession, Inflation -- Tea Leaves -- June 3, 2022

From The WSJ today:

  • employers added 390,000 jobs in May;
  • unemployment steady at 3.6%
  • jobs grew at slowest pace since April of last year, hinting that labor market is starting to cool;

*******************************
Re-Posting

The numbers below refer to "jobless claims."

From May 19, 2022:

From May 15, 2022:

I remember doing the same back-of-the-envelope analysis in the early days of the blog and coming up with similar numbers. 

Link here. Or direct to paywalled MarketWatch


Sunday, May 15, 2022

Goldilocks Number: 250,000 Initial Jobless Claims -- May 15, 2022

I remember doing the same back-of-the-envelope analysis in the early days of the blog and coming up with similar numbers. 

Link here. Or direct to paywalled MarketWatch


Thursday, April 2, 2020

First Time Unemployment Claims -- Doubled The Consensus Midpoint -- Again, Analysts Way Off -- April 2, 2020

Jobs: link here -
  • prior: 3.283 million
  • revised: 3.307 million (revised upward)
  • consensus: 2 million to 4.5 million (mid-point: 3.25 million)
  • actual: 6.648 million
  • analysis: this tells me analysts are underestimating how bad this is
Canadian dollar: dropped overnight to 68 cents US but since then recovered a bit.

Gas Buddy, Oklahoma City: one station at 98 cents/gallon.

**************************************
Back to the Bakken

Active rigs:

$22.474/2/202004/02/201904/02/201804/02/201704/02/2016
Active Rigs4365605029

RBN Energy: why US LPG exporters are losing their edge in Asia.
If Saudi Arabia and Russia flood the world with their crude oil in the midst of a global demand crisis, it would have impacts and implications far beyond crude. A ramp-up in Saudi and Russian oil production this spring would also increase their output of associated gas and NGLs. At the same time, the opposite will be happening in the Permian and other liquids-rich U.S. shale plays, where producers, stunned by sub-$25/bbl oil prices, already are pulling back on drilling and later this year will see their oil and NGL production gradually level off and eventually decline. All this is already turning the international LPG market on its head — just last week, U.S. propane exports plummeted by nearly 40% versus the prior week, to only 889 Mb/d. Today, we consider recent extraordinary market developments and their effect on the arb between Mont Belvieu and Far East LPG prices.
Only one well coming off the confidential list today --  Thursday, April 2, 2020: 3 for the month; 3 for the quarter, 258 for the year:
  • 33432, 1,730, EOG, Liberty LR 43-1109H, 33-061-04028, 60 stages, 22.96 million lbs of 100 mesh sand; Parshall, t10/19; cum 131K 1/20;
*********************************
Saturn Has Rings


************************************************
Mississippi Roast

Link here.

Saturday, October 5, 2019

Clearing Out The In-Box -- October 5, 2019

Jobs in America: record number employed; unemployment rate best in 50 years; folks are actually asking "how low can the unemployment rate go?" Mainstream media's headline: job growth slowing down. Well, duh. Unemployment:
  • for whites: 3.2%
  • adult men: 3.2%
  • adult women: 3.1% (will go lower if Biden's plan to bring 720 million women back into the workforce)
  • teenagers: 12.5%
  • Asians: 2.5% (no typo: 2.5%) -- I find that interesting that Asian unemployment is actually lower than "white" unemployment -- reverse discrimination? Harvard has a plan to stop that, I know.
  • Hispanics: at 3.9%, a record low; has never been this low; never;
  • African-Americans: maintains record low of 5.5% set in August
Less than a week away, 10/10/19:


Apple: strong demand for the new iPhone 11;
Pacific Northwest: looking forward to higher gasoline prices; link here at Platt's --

  • west coast refineries operating at just 78% of capacity
  • the lowest since November, 2016
  • almost 20% lower than this time last year
  • why: can't get enough crude oil
  • why: Pacific Northwest limiting CBR
  • much more at the linked site
Wind capacity in the US: EIA link here, September 27, 2019;

So, how do you interpret this headline (link here):


At the linked article:
  • 3,204 MW of solar gas canceled in ERCOT
  • 284 MW ok'd for operation -- 
  • yeah, that's what I thought; "284" is such a small number, I thought it was all wind/solar; wrong
  • I thought was solar
  • nope, here's the data:
  • fifteen projects (wind, solar, natural gas) were canceled in September
  • two projects went forward
    a 100-MW natural gas plant
  • a 184-MW wind farm (at 25% likely production, translates to 46 MW)
Later: regarding the ERCOT story above, I was "appalled" to the degree which the ERCOT folks would try to spin this story. Apparently another reader saw the very same thing; that reader wrote me:
The quotes trying to make this great news for solar seems to be a real stretch.
Of the 3,204 MW of generation canceled in September, 2,491 MW was solar and 713 MW was gas-fired. Manan Ahuja, S&P Global Platts Analytics manager of North American Power analytics, noted that the number of projects canceled was not unusual, exactly equal to last September's project cancellations.
I first saw that story at twitter:


Fake news: "jobs drying up in the Permian" -- read the story to see for yourself and if still confused, read the comments; first hint that it's fake news -- it's an "oil" story by Bloomberg

Social Security:
  • for all those folks who were worried that "Social Security" would run out of money, not gonna happen; need proof? 
    • politicians who make the Social Security laws are now looking at increasing benefits across the board
  • it's going to be hard for a senior to vote "against" Pocahontas when she promises an increase of $200/month for all Social Security recipients;
  • Paul Krugman: debt doesn't matter; 
  • the story is not in some left-leaning tabloid; it's in The Wall Street Journal;
Disclaimer: this is not an investment site.  Do not make any investment, financial, job, travel, career, or relationship decisions based on what you read here or think you may have read here.

Investing: will Enbridge (ENB) beat estimates again? Clickbait: the article doesn't give estimates for the 3Q19 report, unless I missed that, which is very possible. So, what are estimates for ENB this quarter?
  • mean estimate: 39 cents (EPS last quarter: 50 cents)
  • high: 42 cents
  • low: 30 cents
For the next fiscal year:
  • range: $1.60 to $2.15
  • mean estimate: $2.00
Do you really want to park your Tesla in your garage, attached to your McMansion? Unless you have a mother-in-law bedroom above the garage? Link here.
  • Close reading of the article suggests that "over-charging" the batteries is the problem. Tesla fixed that problem by over-the-air software updates to prevent over-charging. The updates reduced the range of the involved Teslas by 25 miles. 
  • Murphy's law of EVs: when you have but 20 miles range remaining, the map reveals the next EV charging station 25 miles away.

Best quote of the day, from a reader: "I hope Ruth Bader Ginsburg lives long enough to see Trup re-elected."

*********************************
For The Granddaughters

Friday, February 1, 2019

Jobs Numbers Suprise; More Jobs Than Expected; No Wage Inflation -- February 1, 2019

Yesterday I mentioned that CNBC completely misread the weekly jobs report. Wow, was I correct on that one! Wow!

 
By the way, these are the four signs I see most often in Texas:
  • no warning shots
  • stop signs (advisory)
  • DQ signs (Dairy Queen)
  • "now hiring all shifts"

From the linked article:
The January jobs report shows the U.S. labor market is still chugging along.
The U.S. economy added 304,000 non-farm payrolls in the first month of 2019, ahead of consensus expectations of 165,000. This compares to a downwardly revised 222,000 in December, from 312,000 in the previous report.
The unemployment rate rose to 4%. December’s unemployment rate was left unchanged from 3.9% previously.
Average hourly earnings rose 0.1% over December and 3.2% over last year. This compares to consensus estimates of a 0.3% increase and 3.2% increase, respectively, for January average hourly earnings. In December, wage growth increased 0.4% month-over-month and 3.3% year-over-year, after revisions. Hourly earnings are closely watched as a key gauge of inflation.
Did you all catch that intro to the third paragraph: no wage inflation. Repeat, in case Steve Liesman fails to mention it: no wage inflation. Okay, maybe some.

Recession? What recession?

Tell me again why we're supposed to be "resisting" or what we are "resisting"?

I tracked "jobs numbers" for several years. I then quit. I "understood" the methodology and the data and I got bored with the numbers. But if interested, one can start here. I provided what I called the "magic numbers" when I posted the "jobs report" the first time, and then updated it when the mainstream media moved the goalposts when Trump was elected president. Before the goalposts were moved, the magic numbers were defined by the mainstream press as:
First time claims, unemployment benefits: 400,000 (> 400,000: economic stagnation)
New jobs: 200,000 (however, now I see that the goal posts have been moved to 120,000) --  
Economists estimate the labor market needs to create about 125,000 jobs a month to keep the unemployment rate steady, though estimates vary -- Reuters.
The Magic Numbers (change with Trump administration -- see this post)
First time claims, unemployment benefits: 275,000 (> 250,000: economic stagnation)
New jobs: less than 150,000 (less than150,000 new jobs: economic stagnation)
Economists estimate the labor market needs to create about 125,000 jobs a month to keep the unemployment rate steady, though estimates vary -- Reuters.
Tell me again why we're supposed to be "resisting" or what we are "resisting"?

By clicking on this tag, "jobs," one can see how an "unexpected 304,000 jobs" compares with data points from the past.

Friday, January 4, 2019

This Is Worth A Stand-Alone Post -- January 4, 2019

See this post also.


The Jobs Report Was Huge -- January 4, 2019

See this note also

When I saw the numbers, this was my unedited, not ready-for-prime-time e-mail note to a reader:
Supports my theory that movers and shakers around the world are purposely trying to push the US into a recession to destroy Trump. I don't see any data to suggest US economy is doing poorly -- at least to the extent that the stock market is imploding.
The New Time Times said that before the data was released that "if the month's figure reaches or exceeds the expectation of 180,000, it would be a solid cap to a year of robust hiring."


Link at The New York Times.

I've Never Seen "Whopping" Used In Mainstream Media To Report US Jobs -- January 4, 2019

Jobs: link here.


I tracked "jobs numbers" for several years. I then quit. I "understood" the methodology and the data and I got bored with the numbers. But if interested, one can start here. I provided what I called the "magic numbers" when I posted the "jobs report" the first time, and then updated it when the mainstream media moved the goalposts when Trump was elected president. Before the goalposts were moved, the magic numbers were defined by the mainstream press as:
First time claims, unemployment benefits: 400,000 (> 400,000: economic stagnation)
New jobs: 200,000 (however, now I see that the goal posts have been moved to 120,000) --  
Economists estimate the labor market needs to create about 125,000 jobs a month to keep the unemployment rate steady, though estimates vary -- Reuters.
The Magic Numbers (change with Trump administration -- see this post)
First time claims, unemployment benefits: 275,000 (> 250,000: economic stagnation)
New jobs: 150,000 (< 150,000 new jobs: economic stagnation)
Economists estimate the labor market needs to create about 125,000 jobs a month to keep the unemployment rate steady, though estimates vary -- Reuters.
By clicking on this tag, "jobs," one can see how a "whopping 312,000 jobs" compares with data points from the past.

*******************************************
Back to the Bakken

Wells coming off confidential list today -- Friday, January 4, 2019:
  • 33754, 1,082, Oasis, Crane Federal 5300 34-27 7B, 50 stages, 10 million lbs, Willow Creek, t7/18; cum 105K 11/18; #21903 -- see this post.
  • 33664, SI/NC, MRO, Bears Arm USA 41-2H, Reunion Bay, no production data,
  • 33588, 378, Oasis, Muri 5298 14-28 9T, Three Forks, 50 stages, 4 million lbs, Banks, t7/18; cum 84K 11/18;  #18651, #18980 --
Active rigs:

$48.321/4/201901/04/201801/04/201701/04/201601/04/2015
Active Rigs64544059171

RBN Energy: south Texas feedgas demand ramping up with Corpus Christi LNG, part 3.
Feedgas demand for U.S. LNG exports has accelerated in recent months with the addition of new liquefaction and upstream pipeline capacity. The latest export facility contributing to the winter surge in feedgas flows is Cheniere Energy’s Corpus Christi LNG (CCL) in South Texas — the first greenfield LNG export terminal in the Lower 48 and the first such terminal, greenfield or otherwise, in Texas. Train 1 has yet to be commercialized, but already it’s added 0.5 Bcf/d of gas demand to the Texas market through December. The facility sources its gas via a number of legacy interstate and Texas intrastate pipelines, many of which have undergone reversals and expansions in order to serve LNG terminals but also another competing export market: Mexico. How will CCL change gas flows in South Texas? Today, we provide an update of feedgas flows to Corpus Christi, including a closer look at the upstream pipeline routes facilitating those flows.
This is Part 3 in our blog series examining recent changes in U.S. LNG export demand and the pipeline flows feeding it — a subject we cover comprehensively on a weekly basis. First, we started with the latest on Cheniere’s Sabine Pass Liquefaction terminal (SPL) in Cameron Parish, LA, where the start-up activities for Train 5, along with the full in-service of a new feedgas route via Kinder Morgan Louisiana Pipeline’s Sabine Pass Expansion project, have boosted feedgas flows to well over 3 Bcf/d in recent weeks. Then, we shifted our focus to Dominion’s Cove Point LNG export facility in Maryland, where the in-service of two pipeline expansions — Williams/Transco’s Atlantic Sunrise and TransCanada/Columbia Gas Group’s WB Xpress — has improved supply connectivity, with daily volumes consistently near or at capacity for the first time since the single-train facility began producing LNG.

Friday, December 7, 2018

Wage Inflation? Nope. Not Enough Workers? Nope. Economy Booming? Nope. Fed Plans To Raise Rates To Slow The Economy? Yup -- December 7, 2018

... and then folks wonder what the market is tanking. This has nothing to do with tariffs. This is all about the Fed. 

From CNBC: job growth falls short of expectations in November.
  • 155,000 payrolls created vs 198,000 estimate  -- see below --  using the new numbers, 155,000 is right at "economic stagnation"
  • nonfarm payrolls increased by 155,000 in November, the Labor Department says
  • economists surveyed by Dow Jones had been expecting payroll growth of 198,000
  • the average hourly earnings gain of 0.2 percent fell short of estimates for a 0.3 percent increase 
  • October's jobs count was revised lower from an initially reported 250,000 to 237,000.
Again, Trump saw this coming. I find it amazing he gets these things right. The smartest guys in the room, regarding jobs, wages, the economy, supposedly the "Fed." And the Fed continues to raise rates and plans to raise rates again this month. About the last thing that's needed right now. And Trump was very, very aware of this. Weeks ago.

I quit tracking "jobs" data some months ago. As a reminder, linked at the sidebar at the right:
The Magic Numbers (changed with the Trump administration -- see earlier pages -- at the link -- for previous "magic numbers")
First time claims, unemployment benefits: 275,000 (> 250,000: economic stagnation) 
New jobs: 150,000 (< 150,000 new jobs: economic stagnation)
*************************************
And With This, I Think I Will Call It A Morning -- See You Later Today


I had a dozen pair of very expensive cowboy boots, each with a different exotic leather, including shark, elk, elephant, ostrich, that I had purchased over the years, mostly from a western boot and clothing store at the south end of Williston, on the west side of the street. I'm sure folks remember that store. The first purchases were made in the 1970s; most in the early 80s. Most of the boots had never been worn; all were in pristine condition, and all in original boxes.

About one year ago, I gave them all away -- free, no receipt, no tax write-off, nothing -- I simply walked into a western boot store on Main Street, Grapevine, TX, asked the owner if she would like a dozen pair of incredibly nice boots. She had a huge business in re-selling top-of-the-line boots. All I wanted was to make sure the boots got a nice home. I took photographs of all of them and that was it. Never looked back. I don't know her name; she doesn't know mine.

I never thought about the possibility the boots might have been confiscated had I taken them to California.

And yes, one was python.

Thursday, October 4, 2018

Continuing Claims For Unemployment At 45-Year Low -- October 4,2 018

The headline you will only see here: with regard to jobless claims, the 4-week moving average is at a 45-year low. Forty-five years ago was 1973. 
  • folks working are not drawing (or drawing less) government benerits
  • folks working are paying into social security
  • many folks working are paying federal income tax
  • some folks working are paying state income tax
  • some folks working are buying Apple Watches
  • almost all folks take some type of motorized transportation to work
  • almost all motorized transportation uses crude oil derivatives
  • what's not to like
  • a lot of working people won't find time to get away from their jobs to vote
Jobs: wow, low numbers.
  • forecast: 213K
  • actual: 207K -- wow
  • the 4-week average for continuing claims fell 13,000 in lagging data for the September 22 week to 1.665 million which is a 45-year low
*****************************
Sioux Falls

Bloomberg got the headline wrong, but the story is great, nonetheless. The headline:

Why Sioux Falls Is Booming South Dakota’s biggest city isn’t a college town or a state capital or in the Sun Belt. So how does it keep growing and growing?

In fact, Sioux Falls is a college town: it has a university and a college, I believe.
There are 63 metropolitan areas in the U.S. (out of 382 total) that saw their populations grow by 10 percent or more from 2010 through mid-2017, according to estimates compiled by the Census Bureau. That compares with an increase of 5.5 percent for the nation as a whole, and 6.5 percent for its metropolitan areas — which, just to be clear on what we’re talking about, are defined as “one or more counties that contain a city of 50,000 or more inhabitants, or contain a Census Bureau-defined urbanized area and have a total population of at least 100,000 (75,000 in New England).”
Thirty-nine of these fast-growing metros are in the South and 19 in the West. This should come as no big surprise, given that these two regions are estimated to have accounted for 86 percent of the country’s almost-17-million-person increase in population since 2010. None of the fast-growth areas is in the Northeast, but there are five in the slowest-growing of the four regions delineated by the Census Bureau: the Midwest.
One of these Midwestern standouts, Iowa City, Iowa, is home to a large research university, a frequent catalyst for local economic success. Another, Des Moines, Iowa, is a state capital with a metro-area population of 645,911, which is in keeping with urbanist Aaron Renn’s dictum that “If you want to be a successful Midwestern city, it helps to be a state capital with a metro area population of over 500,000.”
Two, Bismarck and Fargo, North Dakota, have been beneficiaries of a big shale-oil boom in their state.
That leaves Sioux Falls, South Dakota, which has seen its metro-area population rise 13.5 percent since 2010 (and 68.8 percent since 1990), to 259,094.
There’s no major university in town; local legend has it that city fathers were given the choice 150-plus years ago between the University of South Dakota and the South Dakota State Penitentiary, and they opted for the latter because they figured it would bring more jobs. 1 The state capital, Pierre, is more than a three hours’ drive away. The signature local industry used to be meatpacking — and there’s still a big, exceptionally fragrant Smithfield Foods Inc. pork-processing plant along the Big Sioux River about a mile north of downtown.
******************************
MDU Acquires Sioux Falls Construction Company

From press release:: Sweetman Construction Company of Sioux Falls, SD; will become part of Knife River Corporation.

Pales in comparison to what Oasis has become. Just saying.

Friday, December 8, 2017

November Jobs Report -- Making America Great Again -- One Has To Ask: What Was Obama Doing For Eight Years? -- December 8, 2017


Not being widely reported: unemployment rate among Hispanics is 4.7% -- lowest on record in the US, via Twitter.


Jobs report for November:
  • forecast: nonfarm payrolls grow by 200,000
  • actual: nonfarm payrolls grow by 280,000
  • unemployment rate holds steady at 4.1%
  • wage growth disappoints: forecast for 2.7% growth; actual, 2.5%
  • U6 (now being reported by the mainstream media; a data point not reported during the Obama administration: 8% (up 0.1%)
  • not in the labor force: edged higher by 35,000 to 95.4 million
Or more bluntly: jobs report crushes expectations!
  • the unemployment rate held at a 17-year low
  • manufacturing sector added 31,000 jobs; manufacturing unemployment rate fell to a record-low 2.6%
2.2 million new jobs since election: Gateway Pundit
  • President Trump's economy is simply "on fire"
  • after the same period under President Obama, 4.8 million jobs were lost, and unemployment skyrocketed to 9.9%
  • according to the Bureau of Labor Statistics: under President Trump more Americans are in the work force than ever before
  • over 160 million Americans are working for the first time in US history
  • ADP reported 40,000 new manufacturing jobs in November: this was the highest monthly amount of new manufacturing jobs in the history of their report
With regard to the "magic numbers":
For "new jobs," 125,000 will be the new "base." The final number under the Obama administration, was 156,000. Even though 156,000 was described as "tepid" by The New York Times, it was associated with economic growth.
Now, June 2, 2017 (the Trump administration), Steve Liesman (and others) suggest that 121,000 is a fine number
Again, one needs to ask: what was Obama doing for eight years.

We would not have seen these numbers under a Hillary administration.

The worst the mainstream media could find in this report? U6 ticked up 0.1%, a date point that was not reported by the mainstream media during the Obama administration.

Trump, during the campaign, said he would do this.

Former President Obama is being schooled.

Friday, September 15, 2017

Job Watch

Note: I no longer plan to update "Job Watch." -- May 24, 2018

This is Page7

Trump vs Obama: pending.

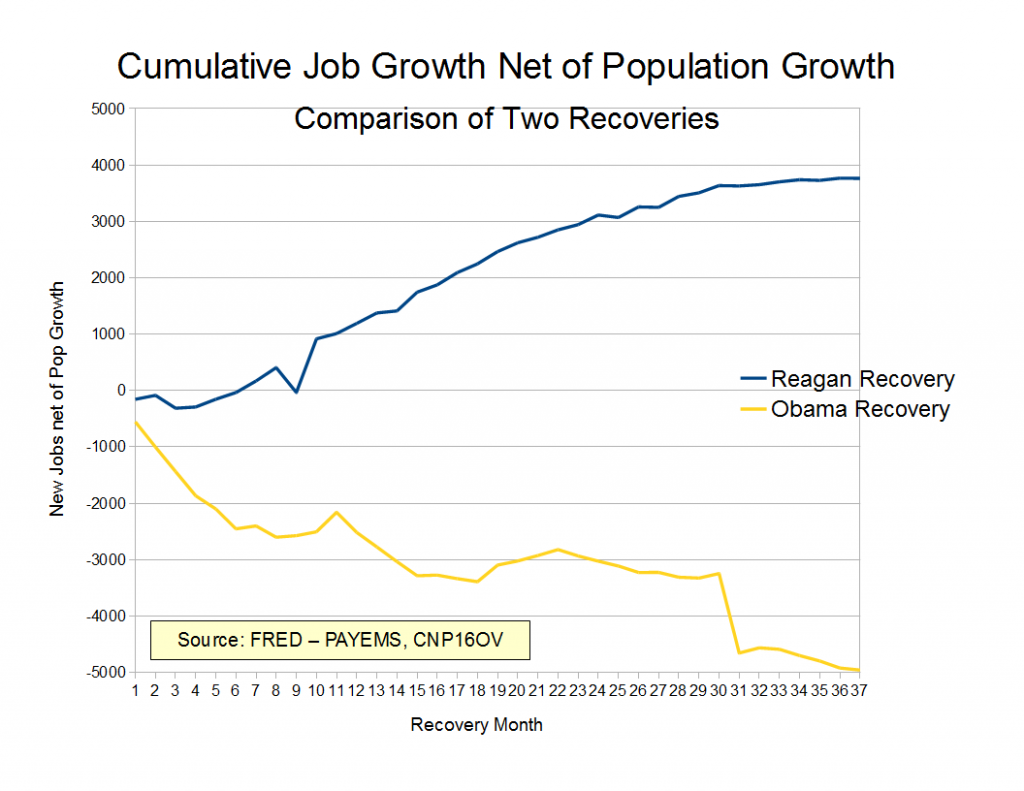
Reagan vs Obama: job recovering following a recession. Reuters and Bloomberg keep telling us job growth is strong, but never seem to really back up that assertion.

The Magic Numbers (change with Trump administration -- see earlier pages for previous "magic numbers")
First time claims, unemployment benefits: 275,000 (> 250,000: economic stagnation)
New jobs: 150,000 (< 150,000 new jobs: economic stagnation)
Economists estimate the labor market needs to create about 125,000 jobs a month to keep the unemployment rate steady, though estimates vary -- Reuters
For "first time claims," the mainstream media was consistently happy with first time claims ~ 275,000 under President Obama. In hindsight, the previous number of 400,000 seemed incredibly high.

For "new jobs," 125,000 will be the new "base." The final number under the Obama administration, was 156,000. Even though 156,000 was described as "tepid" by The New York Times, it was associated with economic growth. Now, June 2, 2017, Steve Liesman (and others) suggest that 121,000 is a fine number.

With both these numbers, the Fed under Janet Yellen felt comfortable raising "rates" for the first time in quite some time. [Update: January, 2018: Yellen out, Jay Powell in.]

After about the first two years of posting these updates, it had become clear/obvious that the figures were often suspect, if not outright falsified. On November 18, 2013, it was reported that, indeed, unemployment figures have been falsified.
In the home stretch of the 2012 presidential campaign, from August to September, the unemployment rate fell sharply — raising eyebrows from Wall Street to Washington.
The decline — from 8.1 percent in August to 7.8 percent in September — might not have been all it seemed. The numbers, according to a reliable source, were manipulated.
And the Census Bureau, which does the unemployment survey, knew it.
Take the numbers for what they are worth, I guess. Not much. Rick Santelli, CNBC, January 6, 2017, also suggested the numbers were suspect when the December jobs report, at 156,000, was incredibly bad, and yet unemployment number (4.7%) did not change.

Updates

December 7, 2018: jobs data suggests early signs of economic stagnation, and the Fed is still on a path to raise rates.

June 21, 2018: I will no longer follow "jobs" on a regular basis. Updates will only be provided when something remarkable happens. The Trump administrations is making America great again.

May 24, 2018: new claims far surpass forecast -- 234,000 vs 220,000 forecast.

May 10, 2018: unchanged from previous week, at 211,000 (less than the 220,000 forecast).

May 3, 2018: jobless claims -- essentially flat despite 24,000 decline last week.

May 2, 2018: ADP numbers leave CNBC analyst (an Obama apologist) speechless.

April 19, 2018: flat, down 1,000.

April 12, 2018: at 233,000.

April 6, 2018: bad reports all around. First, yesterday's first time unemployment claims surge 24,000, well more than forecast. Today, jobs added in March fall well short of forecast. Unemployment remains unchanged at 4.1%

March 29, 2018: lowest in 45 years; lowest since January, 1973.

March 22, 2018: unremarkable; 229,000 vs 226,000 forecast.

March 15, 2018: jobs report unremarkable; 226K first time unemployment claims

March 9, 2018: huge report -- jobs report for February:
  • forecast: 200,000
  • actual: an incredible 313,000
February 22, 2018: huge report; 45-year-low. Now down to 220,000. 

February 2, 2018: a very, very solid jobs report for January, 2018. Forecast: 177,000 jobs added; actual, 200,000 jobs added. "Very, very solid" -- CNBC.

February 1, 2018: a "healthy" 238,000 jobs added in January -- ADP.

January 25, 2018: rebound from last week, but still beat forecasts

January 18, 2018: record plunge in first time claims. Claims drop 4x greater than forecast.

January 11, 2018: unexpected surge; now up to 261,000; up 11,000 (or 9,000); harsh winter conditions blamed;

January 4, 2018: up 3,000 to 250,000; previous week revised slightly;

December 20, 2017: rise more than expected.

December 8, 2017: incredible jobs report.

November 30, 2017: essentially unchanged; at 238,000 (I assume the gap from November 16 report was due to Thanksgiving.)

November 16, 2017: claims surge; more than expected; up 10,000 to 239,000.

November 9, 2017: one week claims surge by 10,000; a bit more than forecast; but look at this -- four-week average: declined 1,250 to 231,250, the lowest point for the average since 227,750 in the March 31, 1973 week

November 3, 2017: unemployment at lowest rate since December, 2000 -- 4.1%. 

October 26, 2017: increased less than expected (good news); rose 10,000 to 233,000;

October 19, 2017: US unemployment claims fall to 222,000, lowest in 44 years.

October 4, 2017: hurricane effect; ADP dropped to a paltry 135,000 but "the market" is looking past these figures. 

September 28, 2017: first time claims up 12,000. The four-week average surged by 9,000, to 277,750, the highest level since February, 2016. 

September 21, 2017: huge, unexpected drop. The forecast was for first time claims to actually increase from 284,000 to 303,00 -- an increase of almost 20,000 first time claims. In fact, the number dropped. And it did not drop by an insignificant amount. The drop was huge. The number of first time unemployment claims dropped 23,000. If one adds the 20,000 forecast to the 23,000 decrease, the analysts were a) off in the direction of the move; and, b) off by more than 40,000 claims. 

Sunday, August 20, 2017

Making America Great, Images And Graphs -- November, 2016 -- November, 2017

This was in draft. It appears that I originally drafted it August 20, 2017, to be posted later. I'm posting it now simply to close out several posts in draft.

Read GDP, historical:


Unemployment:


The graph above is hard to interpret. At least it was for me. Two points are being made:
  • after the November, 8, 2017, election, the overall U3 unemployment plummeted
  • the Journal focused on the unemployment rate of those who "flipped" -- those who had voted for Obama in the previous election, but voted for Trump in this election -- although the bold red line catches one's attention, it appears that "all" voters participated in better employment picture
But then, connect that bold red line to specific states -- Michigan, Wisconsin, Pennsylvania -- the three states that gave the election to Trump were "in" that red line. See graph below.


June 20, 2017:


July 7, 2017:

Thursday, July 20, 2017

Am I Missing Something? This Is Not A Headline Story? -- July 20, 2017

Initial claims for state unemployment benefits dropped 15,000 to a seasonally adjusted 233,000 for the week ended July 15, the Labor Department said on Thursday. That was the lowest level since February, when claims fell to 227,000, which was the best reading since March 1973.  

Jobs. From tradingeconomics.com:
  • first time claims: down 15,000 to 233,000
  • not even mentioned on mainstream media
  • forecast: 245,000 
  • Reuters says it was near a 5-month low and not even mentioned on mainstream media (it probably was; I probably just missed it) 


Max look:


*******************************
Pensions Being Slashed

From cbsnews:
The Central States Pension Fund was the first to actually be approved for this triage under a 2014 law known as the Multiemployer Pension Fund Reform Act. Many pension advocates call it unfair.

"It was run through Congress in the dead of night, and President Obama -- who was supposed to be for the working class -- signed it," complained Burruel. The fund is overseen by attorney Kenneth Feinberg, known for dividing up huge settlements in cases such as the 9/11 terrorist attack and the BP (BP) oil spill in the Gulf.

However, it's not clear what would be fair. The hammer is falling on the private pension funds that are running out of cash. And those shortfalls have many reasons. "The stock market crash had a huge effect," said Outreach Director Joellen Leavelle of the Pension Rights Center. "Some plans lost billions." It was a loss from which they never recovered.

Friday, April 7, 2017

US Manufacturing Jobs HIt 8-Year Record -- What The Heck Was Obama Doing For Eight Years? -- April 7, 2017

The jobs report for March, 2017, was atrocious. But if this story is accurate, it's quite a story, and again raises the question: what in the world was Obama doing for eight years? The story: US manufacturing jobs reach highest level in 8 years.
The United States added 11,000 jobs in manufacturing in March reaching a total of 12,392,000 people employed in the manufacturing sector, according to data released today by the Bureau of Labor Statistics.
That is the greatest number of people employed in manufacturing in the United States since January 2009—the month that President Barack Obama was inaugurated—when there were 12,561,000 people employed in manufacturing. In February 2009, manufacturing employment dropped to 12,380,000—a number it did not exceed until February of this year, when it reached 12,381,000.