Locator: 48690GUYANA.

A musical interlude, link here:
AAPL / Apple: after hearing Jim Cramer's interview with Peter Navarro on CNBC early this morning, one could certainly argue Apple could be in a lot of trouble. It certainly sounds like Navarro is the one behind Trump's irritation with Apple, and will do what it takes to make Apple "bow" to the administration's demands. In the interview Navarro had two points: tariffs are not the problem; JPow is the problem. Apple? Collateral damage. It certainly felt to me that Jim Cramer lost the debate with Navarro. It appears that Trump / Navarro / Frank Dikötter understand China and China's Achilles' heel.
Peter Kent Navarro (born July 15, 1949, 76 years old) is an American economist who has been the senior counselor for trade and manufacturing to U.S. president Donald Trump since January 2025.
He previously served in the first Trump administration, first as the director of the White House National Trade Council, then as the director of the new Office of Trade and Manufacturing Policy.
*********************************
E-Retail
I honestly don't know what "to do" with this chart -- see below -- except to note that there's probably a reason that only Amazon and Walmart are shown in this graphic. Seriously, when it comes to "what they do," is there anyone else?
If I didn't know anything about investing, it seems I would want one or both of these as a component of my portfolio. If one is unhappy with BRK, might one replace BRK with AMZN/WMT?
Remember, this is not an investment site.

Note, link here:

SOFI: what's going on over at SOFI? Link here. Reminder: all three of these "financial entities" are "Stanford alumnae": Schwab, SOFI, and Robinhood.

*******************************************
Disclaimer
Brief
Reminder
Briefly:
Locator: 48688ZAVANNA.
Five new permits, #42092, - #42096, inclusive:
The map:

Production profiles:
| Pool | Date | Days | BBLS Oil | Runs | BBLS Water | MCF Prod | MCF Sold | Vent/Flare |
|---|---|---|---|---|---|---|---|---|
| BAKKEN | 5-2025 | 31 | 20387 | 20554 | 23355 | 42066 | 41161 | 634 |
| BAKKEN | 4-2025 | 30 | 27140 | 27007 | 29061 | 51699 | 50474 | 831 |
| BAKKEN | 3-2025 | 27 |
| 30401 | 31878 | 55632 | 54364 | 945 |
| BAKKEN | 2-2025 | 14 | 8389 | 8450 | 10725 | 17726 | 17161 | 259 |
| BAKKEN | 1-2025 | 31 | 12986 | 12859 | 15566 | 23687 | 23018 | 401 |
| BAKKEN | 12-2024 | 0 | 0 | 0 | 0 | 0 | 0 | 0 |
| BAKKEN | 11-2024 | 30 | 83 | 83 | 8586 | 59 | 0 | 59 |
| Pool | Date | Days | BBLS Oil | Runs | BBLS Water | MCF Prod | MCF Sold | Vent/Flare |
|---|---|---|---|---|---|---|---|---|
| BAKKEN | 5-2025 | 31 | 25699 | 25906 | 15584 | 56030 | 54983 | 799 |
| BAKKEN | 4-2025 | 30 | 33817 | 33639 | 18703 | 65839 | 64539 | 1036 |
| BAKKEN | 3-2025 | 31 | 35410 | 35459 | 37826 | 59641 | 58270 | 1098 |
| BAKKEN | 2-2025 | 28 | 28566 | 28341 | 33690 | 51066 | 49827 | 980 |
| BAKKEN | 1-2025 | 0 | 0 | 0 | 0 | 0 | 0 | 0 |
| BAKKEN | 12-2024 | 0 | 0 | 0 | 0 | 0 | 0 | 0 |
| BAKKEN | 11-2024 | 0 | 0 | 0 | 5998 | 38 | 0 | 38 |
| Pool | Date | Days | BBLS Oil | Runs | BBLS Water | MCF Prod | MCF Sold | Vent/Flare |
|---|---|---|---|---|---|---|---|---|
| BAKKEN | 5-2025 | 31 | 7135 | 7165 | 9517 | 23190 | 22616 | 343 |
| BAKKEN | 4-2025 | 30 | 7486 | 7526 | 11834 | 31646 | 31086 | 229 |
| BAKKEN | 3-2025 | 31 | 9650 | 9663 | 13470 | 44041 | 43308 | 293 |
| BAKKEN | 2-2025 | 28 | 11399 | 11375 | 13363 | 29716 | 28675 | 753 |
| BAKKEN | 1-2025 | 31 | 11112 | 11313 | 11072 | 39083 | 38371 | 337 |
| BAKKEN | 12-2024 | 30 | 29686 | 29747 | 28691 | 63936 | 60697 | 2665 |
| BAKKEN | 11-2024 | 30 | 34380 | 34336 | 31749 | 76657 | 74703 | 1135 |
| BAKKEN | 10-2024 | 30 | 39223 | 39339 | 34157 | 81570 | 79515 | 1216 |
| BAKKEN | 9-2024 | 30 | 37628 | 37644 | 32938 | 72651 | 70281 | 1155 |
| BAKKEN | 8-2024 | 31 | 39837 | 39429 | 36852 | 72162 | 69946 | 1331 |
| BAKKEN | 7-2024 | 8 | 11146 | 11204 | 10337 | 24154 | 23805 | 343 |
| BAKKEN | 6-2024 | 3 | 9692 | 9980 | 3716 | 21884 | 21578 | 300 |
| BAKKEN | 5-2024 | 31 | 50849 | 50695 | 48076 | 90234 | 89604 | 609 |
| BAKKEN | 4-2024 | 30 | 10139 | 9849 | 8206 | 13069 | 12742 | 305 |
| BAKKEN | 3-2024 | 31 | 0 | 0 | 7346 | 0 | 0 | 0 |
| BAKKEN | 2-2024 | 9 | 0 | 0 | 0 | 0 | 0 | 0 |
Locator: 48687B.
WTI: $67.89. Up 2%, some say due to Houthis hitting second cargo ship in the Red Sea.
Active rigs: 32.
Five new permits, #42092, - #42096, inclusive:
Three permits renewed:
One permit canceled:
Locator: 48686CHIPS.
AI: more proof, if you needed any, for investors, the story is real.
These companies have a lot of money and are consolidating -- this is like the Bakken boom. During the early stages of the boom, time is money and companies need to be fast to stake what they need. Later on, in the manufacturing stage, after the boom itself, deals will be fewer in number and it takes longer to close for many reasons. Earlier in the AI boom, the Mag-7 bought a lot of the upstarts, but now it's the second-tier companies that are buying upstarts, let's call these second-tier companies the Next-33. 33+7 = Coatue's Fantastic 40.
NVDA: look at this -- this is huge --
I don't think folks get it. Chips don't equal chips -- first of all there are at least four main classes: CPUs, GPUs, storage; and NPUs. Those four classes are not interchangeable. To some extent, within a class, chips made by one company are interchangeable with chips made by another company, and a lot of folks feel there may not be a lot of difference. I don't know. But once someone has "name recognition," let's say Nvidia, even if AMD's chips are just as good, a lot of folks are going to go with Nvidia vs AMD simply due to "name recognition." Sort of like Hertz and #2 Avis in the old days. And, exactly like brand name Coca-Cola and generic cola.


Locator: 48685ND.
Link here. This is an interesting case. If you can't get past The Bismarck Tribune paywall, link here to US News.

Locator: 48684SAND.
My hunch: this story is coming out of Pennsylvania and the sand was shipped from Minnesota.
Fracking sand is tracked here. Some call it fraccing sand. Others call it fracing sand. Whatever.
The Illinois Basin is tracked here. Wiki here. Maybe something Yuval Noah Harari should read.

From x, link here.


Locator: 48683B.
AI: more proof, if you needed any, for investors, the story is real, see below. These companies have a lot of money and are consolidating -- this is like the Bakken boom. During the early stages of the boom, time is money and companies need to be fast to stake what they need. Later on, in the manufacturing stage, after the boom itself, deals will be fewer in number and take longer to close for many reasons. Earlier in the AI boom, the Mag-7 bought a lot of the upstarts, but now it's the second-tier companies that are buying upstarts, let's call these second-tier companies the Next-33. 33+7 = Coatue's Fantastic 40.
NVDA: by the way, before we get to the CoreWeave / Core Scientific story -- next to follow, look at this:
CoreWeave to buy Core Scientific: a $9-billion deal.

****************************
Back to the Bakken
WTI: $67.61. Up $1.12.
"Planeloads" of Russians touch down in Iraq to secure oil deals and expand its influence according to an article over at oilprice.
Are we starting to see three sub-spheres of influence in the Mideast region: Trump-Saudi Arabia; Iran-China; Iraq-Russia?
New wells:
Hunt Oil's Clearwater wells will be tracked here. Memo to self: track Hunt Oil's Redmond wells, located in the same Hunt Oil Clearwater area.
RBN Energy: Appalachia gas production growth tied to takeaway adds, in-basin power needs. Archived.
The Marcellus/Utica has massive natural gas reserves, but daily, weekly and annual production in the three-state shale play is limited by three key factors: in-region demand, takeaway capacity and gas prices. In recent years, the basin’s output has been rangebound between 34 and 36 Bcf/d and Appalachian producers see only modest gains in 2025. But a handful of pipeline projects and rising gas demand from power generators suggest the Marcellus/Utica may finally be on the verge of a production breakout. In today’s RBN blog, we discuss the leading E&Ps’ production forecasts for 2025 and the prospects for considerably higher output by the end of this decade.
This is the third blog in our series on recent upstream and midstream activity in the Marcellus/Utica. In Part 1, we noted that while the shale play’s gas production soared from less than 2 Bcf/d to more than 33 Bcf/d in the 2010s, its output through the first half of the 2020s has stayed close to flat, averaging about 35 Bcf/d over that period — ~24 Bcf/d from the NGL-rich “wet” Marcellus/Utica in southwestern Pennsylvania, northern West Virginia and eastern Ohio and ~11 Bcf/d from the “dry” Marcellus in northeastern Pennsylvania. The primary hurdle to further growth has been takeaway capacity; there hasn’t been enough space on the pipelines out of Appalachia to move more of the shale play’s gas to demand centers hundreds of miles away.
In Part 2, we discussed a long list of recently completed, under-construction and planned pipeline projects that provide — or soon will provide — additional egress. These include the 2-Bcf/d Mountain Valley Pipeline (MVP), which started up in June 2024; a host of capacity-enhancement projects along and near the Transco pipeline system that will enable more Marcellus/Utica gas to flow into the Southeast; and the possible construction of the Borealis Pipeline across Ohio (and related improvements to the Texas Gas Transmission system) that would allow more gas to flow south/southwest to Louisiana. We also looked at the three primary drivers for Appalachian gas demand growth in the second half of the 2020s, namely higher in-basin power demand from new data centers, expanding Gulf Coast LNG export volumes, and rising demand for gas in the fast-growing Southeast. Separately, in Family Affair, we discussed Kinder Morgan’s Mississippi Crossing and South System Expansion 4 projects, which would let more Marcellus/Utica gas flow into the Deep South.
Today, we shift our focus to (1) what the leading E&Ps in the nation’s largest gas production area have been saying about their 2025 production and longer-term prospects, and (2) how much production growth the Marcellus/Utica as a whole might experience as gas demand from power generators and other big customers increases.
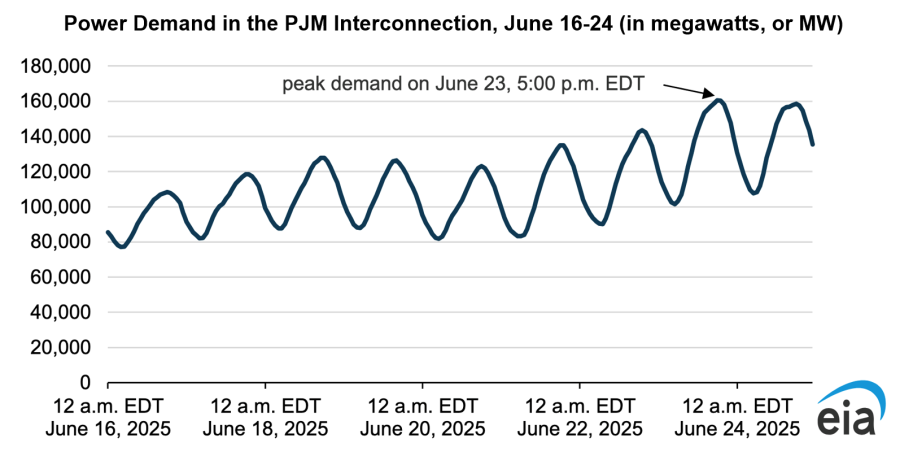
Before we begin, we should note that gas demand in the Eastern U.S. soared the week of June 22, when New England, the Mid-Atlantic states, the Southeast and the Midwest suffered through their first major heat wave of 2025. The Energy Information Administration (EIA) said the PJM Interconnection, the largest wholesale electricity market in the country (reaching from northern Illinois to New Jersey to northeastern North Carolina), experienced near-record demand of more than 160,000 megawatts (MW) on June 23 (see Figure 1 below), and that gas-fired plants provided 44% (or ~71,000 MW) of the power being consumed then. Electricity demand in New England approached record levels the following day, with gas plants providing 47% of the power.

Figure 1. Power Demand in the PJM Interconnection, June 16-24 (in megawatts, or MW). Source: EIA