This is Page7
Trump vs Obama: pending.
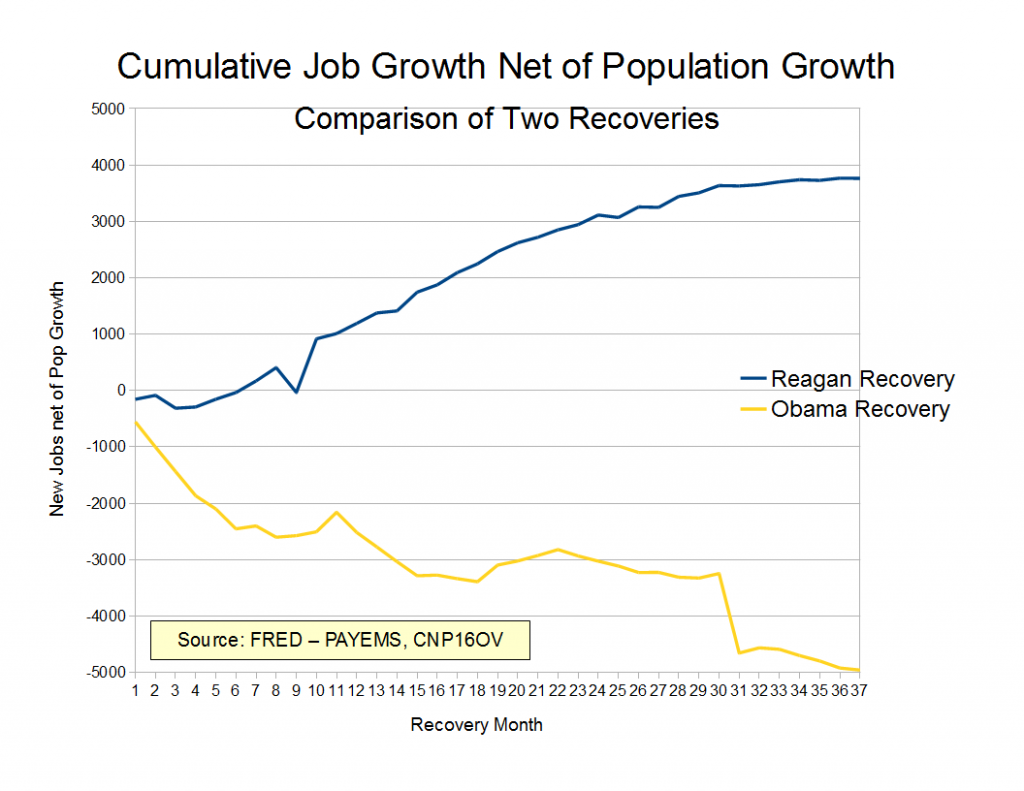
Reagan vs Obama: job recovering following a recession. Reuters and Bloomberg keep telling us job growth is strong, but never seem to really back up that assertion.
The Magic Numbers (change with Trump administration -- see earlier pages for previous "magic numbers")
First time claims, unemployment benefits: 275,000 (> 250,000: economic stagnation)New jobs: 150,000 (< 150,000 new jobs: economic stagnation)
Economists estimate the labor market needs to create about 125,000 jobs a month to keep the unemployment rate steady, though estimates vary -- Reuters.For "first time claims," the mainstream media was consistently happy with first time claims ~ 275,000 under President Obama. In hindsight, the previous number of 400,000 seemed incredibly high.
For "new jobs," 125,000 will be the new "base." The final number under the Obama administration, was 156,000. Even though 156,000 was described as "tepid" by The New York Times, it was associated with economic growth. Now, June 2, 2017, Steve Liesman (and others) suggest that 121,000 is a fine number.
With both these numbers, the Fed under Janet Yellen felt comfortable raising "rates" for the first time in quite some time. [Update: January, 2018: Yellen out, Jay Powell in.]
After about the first two years of posting these updates, it had become clear/obvious that the figures were often suspect, if not outright falsified. On November 18, 2013, it was reported that, indeed, unemployment figures have been falsified.
In the home stretch of the 2012 presidential campaign, from August to September, the unemployment rate fell sharply — raising eyebrows from Wall Street to Washington.Take the numbers for what they are worth, I guess. Not much. Rick Santelli, CNBC, January 6, 2017, also suggested the numbers were suspect when the December jobs report, at 156,000, was incredibly bad, and yet unemployment number (4.7%) did not change.
The decline — from 8.1 percent in August to 7.8 percent in September — might not have been all it seemed. The numbers, according to a reliable source, were manipulated.
And the Census Bureau, which does the unemployment survey, knew it.
Updates
December 7, 2018: jobs data suggests early signs of economic stagnation, and the Fed is still on a path to raise rates.
June 21, 2018: I will no longer follow "jobs" on a regular basis. Updates will only be provided when something remarkable happens. The Trump administrations is making America great again.
May 24, 2018: new claims far surpass forecast -- 234,000 vs 220,000 forecast.
May 10, 2018: unchanged from previous week, at 211,000 (less than the 220,000 forecast).
May 3, 2018: jobless claims -- essentially flat despite 24,000 decline last week.
May 2, 2018: ADP numbers leave CNBC analyst (an Obama apologist) speechless.
April 19, 2018: flat, down 1,000.
April 12, 2018: at 233,000.
April 6, 2018: bad reports all around. First, yesterday's first time unemployment claims surge 24,000, well more than forecast. Today, jobs added in March fall well short of forecast. Unemployment remains unchanged at 4.1%
March 29, 2018: lowest in 45 years; lowest since January, 1973.
March 22, 2018: unremarkable; 229,000 vs 226,000 forecast.
March 15, 2018: jobs report unremarkable; 226K first time unemployment claims
March 9, 2018: huge report -- jobs report for February:
- forecast: 200,000
- actual: an incredible 313,000
February 2, 2018: a very, very solid jobs report for January, 2018. Forecast: 177,000 jobs added; actual, 200,000 jobs added. "Very, very solid" -- CNBC.
February 1, 2018: a "healthy" 238,000 jobs added in January -- ADP.
January 25, 2018: rebound from last week, but still beat forecasts.
January 18, 2018: record plunge in first time claims. Claims drop 4x greater than forecast.
January 11, 2018: unexpected surge; now up to 261,000; up 11,000 (or 9,000); harsh winter conditions blamed;
January 4, 2018: up 3,000 to 250,000; previous week revised slightly;
December 20, 2017: rise more than expected.
December 8, 2017: incredible jobs report.
November 30, 2017: essentially unchanged; at 238,000. (I assume the gap from November 16 report was due to Thanksgiving.)
November 16, 2017: claims surge; more than expected; up 10,000 to 239,000.
November 9, 2017: one week claims surge by 10,000; a bit more than forecast; but look at this -- four-week average: declined 1,250 to 231,250, the lowest point for the average since 227,750 in the March 31, 1973 week
November 3, 2017: unemployment at lowest rate since December, 2000 -- 4.1%.
October 26, 2017: increased less than expected (good news); rose 10,000 to 233,000;
October 19, 2017: US unemployment claims fall to 222,000, lowest in 44 years.
October 4, 2017: hurricane effect; ADP dropped to a paltry 135,000 but "the market" is looking past these figures.
September 28, 2017: first time claims up 12,000. The four-week average surged by 9,000, to 277,750, the highest level since February, 2016.
September 21, 2017: huge, unexpected drop. The forecast was for first time claims to actually increase from 284,000 to 303,00 -- an increase of almost 20,000 first time claims. In fact, the number dropped. And it did not drop by an insignificant amount. The drop was huge. The number of first time unemployment claims dropped 23,000. If one adds the 20,000 forecast to the 23,000 decrease, the analysts were a) off in the direction of the move; and, b) off by more than 40,000 claims.