Showing posts sorted by date for query "Area under the curve". Sort by relevance Show all posts

Sunday, June 1, 2025

Manic Monday -- June 2, 2025

Locator: 48657B.

Disclaimer
Brief Reminder 

 Briefly:

  • I am inappropriately exuberant about the Bakken and I am often well out front of my headlights. I am often appropriately accused of hyperbole when it comes to the Bakken.
  • I am inappropriately exuberant about the US economy and the US market.
  • I am also inappropriately exuberant about all things Apple. 
  • See disclaimer. This is not an investment site. 
  • Disclaimer: this is not an investment site. Do not make any investment, financial, job, career, travel, or relationship decisions based on what you read here or think you may have read here. All my posts are done quickly: there will be content and typographical errors. If something appears wrong, it probably is. Feel free to fact check everything.
  • If anything on any of my posts is important to you, go to the source. If/when I find typographical / content errors, I will correct them. 
  • Reminder: I am inappropriately exuberant about the Bakken, US economy, and the US market.
  • I am also inappropriately exuberant about all things Apple. 
  • And now, Nvidia, also. I am also inappropriately exuberant about all things Nvidia. Nvidia is a metonym for AI and/or the sixth industrial revolution.
  • I've now added Broadcom to the disclaimer. I am also inappropriately exuberant about all things Broadcom.
  • I've now added Oracle to the disclaimer. I am also inappropriately exuberant about all things Oracle.
  • Longer version here.  

For traders, and perhaps, investors: what's more important -- the monthly "Consumer Confidence" numbers or Tom Lee's prognostications on CNBC?

  • Bitcoin:
    • in 2019, a CNBC host dismissed Tom Lee's advice to invest 1 - 2% of a portfolio in Bitcoin at $5,000 as "crazy"; was the host Becky Quick, taking her "advice" from Warren Buffett? It seems likely.
    • today, Tom Lee says Bitcoin is going to $3,000,000 -- that's $3 million -- per coin.
  • S&P 500:
    • today, Tom Lee says he thinks a new bull market started on April 7th and he never changed his year-end price target for the S&P 500 of 6,600. Today, the S&P 500 is 5,900. At 6,600, that would be a 12% increase.

Like many investors, because of my fear of getting really, really wealthy, I'm missed:

  • Bitcoin;
  • Netflix;
  • Palantir;

Fortunately, I did not miss:

  • Nvidia;
  • AVGO;
  • ORCL;

But I'm still disappointed.

Living in a state with no income tax has softened that blow a bit (missing Netflix, Palantir). 

Tom Lee is a regular guest on CNBC but has never wavered; he has always stood his ground.

  • Benjamin Graham --> Peter Lynch --> Warren Buffett --> Tom Lee?

Beth, from over the weekend, tag AVGO, Boradcom:

Last night/yesterday:

  • NASCAR: tonight, exclusively on Amazon Prime, Nashville. Blaney easily wins. Bigger story: Hocevar comes in second.
  • PGA: Scottie Scheffler wins (again). Surprise comeback. 

Canada: prime minister Mark Carney will fast-track Canadian energy projects. Link to Charles Kennedy so you know it's an important story and well written. Generative AI calls Mark Carney a pragmatic environmentalist. 

Saudi Arabia: to review spending priorities after recent price slide. Link here.

Saudi Arabia needs oil prices at about $90 per barrel to balance its budget. The world’s top crude oil exporter is already running a higher-than-planned deficit, which is set to swell with the oil price dip in the second quarter. On the table: Neom, AI, military defense, oil-producing infrastructure CAPEX.
Oil prices are currently running at $65 at best for Saudi Arabia. Saudi Arabia sees the "price war" between Saudi Arabia and US shale. It's not that simple.

Dividends, Saudi Aramco: With oil prices having crashed into the $60 a barrel range, the Kingdom will look to avoid falling again into the “trap of booms and busts,” Al-Jadaan told FT.

Saudi Aramco's net income for 2024 was $106.2 billion, a decrease from $121.3 billion in 2023. This drop in profit was primarily attributed to lower oil prices and revenue, along with higher operating costs. Despite the earnings decline, the company raised its base dividend for the fourth quarter of 2024 by 4.2%, demonstrating its commitment to shareholder returns. 

However, for 2025: Saudi Aramco announced a significant reduction in its dividend for 2025. They expect to pay out $85 billion, a decrease from $124 billion in 2024. This cut is attributed to a combination of lower oil prices and a shift in financial priorities, including increased capital investments.  I guess that would be a 31% dividend cut for 2025.

Later, Saudi Aramco: just announced, Saudi Aramco completes $5 billion bond issuance. Link here. Look how little $5 billion is compared to all the other figures with regard to Saudi Arabia today. Compare to Warren Buffett:

Record levels: Berkshire Hathaway's cash holdings were over $334 billion at the end of 2024, almost double the $167.6 billion reported at the end of 2023. By March 31, 2025, this increased to $347 billion. Buffett holds $1 for every $20-bill held by the US Treasury IIRC.

*********************************
Back to the Bakken

With regard to the Enerplus wells that are coming off confidential list this week, initial production data has been posted.

WTI: $62.89. a $2-bump following Ukraine's drone attack on four Russian airfields deep into Russia.

New wells:

  • Tuesday, June 3, 2025: 19 for the month, 172 for the quarter, 386 for the year,
    • 41090, conf, Silver Hill Operating, Rooster W Federal 159-94-2-26-1MBHX,
  • Monday, June 2, 2025: 18 for the month, 171 for the quarter, 385 for the year,
    • 40687, conf,  Hess, GO-Jimmy W Hill-157-98--214H-3,
    • 41233, conf, BR, Keene 14-35 TFH,
    • 40909, conf, Rockpoert Energy, Merritt 18-19-30 4H,
    • 40832, conf, Hess, EN-Horst-LE-154-93-03H-1,
    • 40518, conf, BR, Franklin 14-36 TFH,
  • Sunday, June 1, 2025: 13 for the month, 166 for the quarter, 380 for the year,
    • 41201, conf, Silver Hill Operating, Rooster W Federal 159-94-2-26-2TFHX,
    • 40915, conf, Rockport Energy, Annie 7-6-31 4H,
    • 40823, conf, Rockport Energy, Mary Carson 8-5 1H,
    • 40686, conf, Hess, GO-Jimmy W Will-157-98-3526H-2,
    • 40531, conf, Enerplus, Deuce 149-92-19D-18H,
    • 40530, conf, Enerplus, Lumber 149-92-19D-18H,
    • 40529, conf, Enerplus, Curve 149-92-19D-18H,
    • 40528, conf, Enerplus, Dinger 149-92-19C018H,
    • 40527, conf, Enerplus, Juiced 149-92-19C-18H,
    • 40526, conf, Enerplus, Bullpen 149-92-19C-18H,
    • 40525, conf, Enerplus, Southpaw 149-92-19C-18H,
    • 40524, conf, Enerplus, Closer 149-92-19C-18H-LL,
  • Saturday, May 31, 2025: 54 for the month, 154 for the quarter, 368 for the year,
    • None.

RBN Energy: "unacceptable risk" label could disrupt US ethane, butane exports.

After dodging the huge tariffs on exports of U.S. LPG and ethane to China — at least until August 12 — a new wrinkle has emerged. Enterprise Products Partners said in a filing May 29 that the U.S. Bureau of Industry and Security (BIS) has flagged its exports of butane and ethane to China as a security risk; specifically, that they pose an “unacceptable risk of use in or diversion to a military end use.” Details about the licenses and how they will apply are limited at this point, but it appears they will be required for these exports to continue. In today’s RBN blog, we examine the potential impact on the ethane and butane markets. 

In its 8-K filing to the Securities and Exchange Commission (SEC), Enterprise indicated that it is unable to determine, as yet, whether it will be able to acquire such licenses for its exports in a reasonable amount of time, if at all. (An 8-K filing is a mandatory disclosure that public companies must file with the SEC to inform their shareholders and the public about major, unscheduled material events or corporate changes.) There has been no direct word from the other ethane exporter, Energy Transfer, nor exporters of butane, including Targa Resources and Phillips 66 (P66). However, it is reasonable to assume that they received similar letters from the BIS regarding their exports. The location of LPG (propane and butane) and ethane export terminals and the products they export are shown in Figure 1 below. (For more on U.S. LPG and ethane exports, see Hot To Go!)
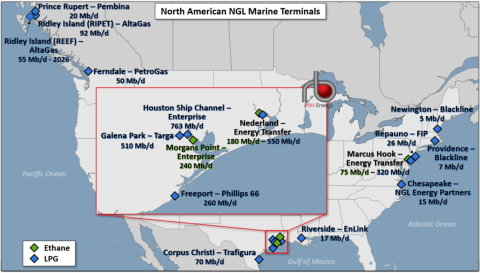
North American NGL Marine Terminals

Figure 1. North American NGL Marine Terminals. Source: RBN

The BIS decision has the potential to ruin the U.S. ethane market and disrupt global flows. The U.S. is the sole source of long-distance ethane exports to China. In the short term, there are no markets that could replace China’s ethane imports nor are there markets that can take most of the U.S. ethane previously destined for China. The impact on the butane market is less severe, as only 5% of U.S. butane exports head to China and the smaller volume can easily be diverted to other countries. For example, butane that would typically head to China from the U.S. could instead be sent to India, and the volume destined for India from, say, the Middle East would then go to China. 

A reminder, the full story below has been released and will be available for a short period of time. This story has much more than the subject heading would indicate. An important read:

RBN Energy: the short- and long-term outlooks for Uinta waxy crude production. Archived.

We’ve discussed the qualities of the Uinta Basin’s unusual waxy crude, the challenges inherent in moving it to market, and the use of machine-learning AI to optimize its extraction from two key geologic layers or “benches” deep below the rugged hills of northeastern Utah. Now, in today’s RBN blog, it’s finally time to reveal what all this tells us regarding the prospects for continued Uinta production growth; the need for new takeaway capacity, blending and refining infrastructure to handle it; and — very important — the estimated duration of economically recoverable waxy crude under various price scenarios. 

This is the third blog in our series on how artificial intelligence (AI) is being used to assess and optimize the development potential of the Uinta Basin, which is now the fastest-growing crude-oil-focused production area in the U.S. on a percentage basis. In Part 1, we discussed the two flavors of Uinta waxy crude (black wax and yellow wax); their positive attributes (great for making high-value lubricants, low levels of sulfur and other impurities, and desirable yields of gasoil, kerosene, naphtha and other essential refined products); and initial production (IP) rates that match — and in some cases exceed — those in the best parts of the Permian.

We also described the challenges of storing and transporting waxy crude, the fast rise in Uinta production (now averaging more than 170 Mb/d), the demand from distant refineries and blenders, and the strain being put on existing midstream and downstream infrastructure. That’s all spurred talk of expansion projects, but E&Ps, rail terminal developers, refiners and blenders are wary of making big up-front investments without having a clear understanding of the Uinta’s long-term prospects and, with that, a high degree of confidence that the basin will remain economically productive long enough for their investments to pay off.

In Part 2, we examined the AI-based analytics our friends at Novi Labs use to (1) understand the individual contributions of a wide range of geologic and operational variables to production levels in the Uinta’s two most extensively drilled benches (Uteland Butte and Castle Peak), (2) employ that understanding to predict the performance of future wells in the two benches, and (3) forecast the volumes of waxy crude that could ultimately be extracted from these benches at various price points. Put simply — well, as simply as we can — Novi Labs’ machine-learning approach begins by gathering and incorporating a broad range of well-specific inputs (geologic, operational and spatial) on hundreds of drilled wells from public and proprietary sources. Novi then leverages the algorithms in the models it developed for each of the two benches, using reams of available data to gain a much deeper understanding of the relationships among and between these many variables and their impact on production outcomes.

In essence, machine learning integrates the wide range of data collected to recognize patterns and identify the primary drivers of well performance. It does this through the development and use of “Shapley values,” a game-theory concept that quantifies the contribution of individual input categories — more on that in a moment — to production from a given well compared to the average of the wells in the area. Machine learning then enables operators to assess how changing specific variables (such as drilling in a higher-pressure area, tightening well spacing, or increasing proppant intensity) would affect production outcomes in wells yet to be drilled. It also provides operators with guidance on how best to lay out, space, and sequence the development of the benches.

Today, we’ll build on the discussion about machine learning and Shapley values, compare the Uinta’s forecast productivity per well to the Permian and Bakken, and look at how much crude the wells in the Uinta’s key benches are likely to produce over time at various price points.

Novi Labs selected about 20 data points or variables (out of a broad set available to it) on hundreds of drilled wells in the Uteland Butte and Castle Peak benches that meet its criteria (at least 90 days of production and values for proppant, completion fluid and lateral length). The geologic data includes things like porosity, total organic carbon (TOC), lithology (the physical and chemical characteristics of the rock) and pressure, plus depth, structural position within the basin and proximity to faults. The operational data, in turn, includes factors such as proppant intensity, fluid volume per foot, stage spacing, lateral length, and the precise placement of the lateral within the bench.

Impact of Proppant Intensity on Uteland Butte Production
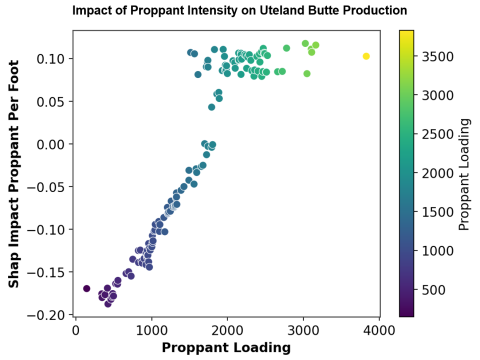
Impact of Proppant Intensity on Uteland Butte Production

Figure 1. Impact of Proppant Intensity on Uteland Butte Production. Source: Novi Labs

Friday, May 30, 2025

TGIF -- Costco Surges -- Tariffs? What Tariffs? -- May 30, 2025

Locator: 48722B.

Costco: surges. Up 2.875; up $28.96; trading at $1,037.70. Still sells their hot dog combo for $1.50. Hasn't changed the price in decades. Decades. Later: up 3.75%; up $37.55; trading at $1,046.32.

Largest company by market cap: MSFT just surpassed Nvidia this morning. It was Nvidia yesterday. A "3.4-handle"? Just checked: $3.41 vs $3.36. Trillion. P/E: 44 vs 35. Remember when "Fast Money" panel said Nvidia (NVDA) couldn't "grow into their P/E"? Wow. 

Trump tween this morning: China violated trade agreement. Stocks fall. Another opportunity for traders, investors,

Netflix: new target -- $1,350. Wow. 

Whoo-hoo! All of a sudden two basins are back in the news -- the Utica and the Uinta. 

US military spending: I'm not sure this guy knows what he's talking about. Link here to The New York Times. The best example: amphibious landing craft. LOL.

Tariffs setting record collections for US Treasury. Link here. Liz Ann Sonders. 

The Times and Amazon ink a marketing deal. Link here to The New York Times.

Palantir: Trump will clean up the Signal mess. Link here to The New York Times. Last month: link to The New York Times. 

Trump: Over and over and over: examples of Trump not messing around. Addresses problems immediately. Before the press multiple times per day. Biden: "We're monitoring the situation." Appears before the press multiple times each decade.

Monthly crude oil field production data: scheduled to be released today. Link here.

BRK-B: month-to-date -- down almost 5.55.

********************************
Back to the Bakken

WTI: $60.08.

New wells: 

  • Monday, June 2, 2025: 18 for the month, 171 for the quarter, 385 for the year,
    • 40687, conf,  Hess, GO-Jimmy W Hill-157-98--214H-3,
    • 41233, conf, BR, Keene 14-35 TFH,
    • 40909, conf, Rockport Energy, Merritt 18-19-30 4H,
    • 40832, conf, Hess, EN-Horst-LE-154-93-03H-1,
    • 40518, conf, BR, Franklin 14-36 TFH,
  • Sunday, June 1, 2025: 13 for the month, 166 for the quarter, 380 for the year,
    • 41201, conf, Silver Hill Operating, Rooster W Federal 159-94-2-26-2TFHX,
    • 40915, conf, Rockport Energy, Annie 7-6-31 4H,
    • 40823, conf, Rockport Energy, Mary Carson 8-5 1H,
    • 40686, conf, Hess, GO-Jimmy W Will-157-98-3526H-2,
    • 40531, conf, Enerplus, Deuce 149-92-19D-18H,
    • 40530, conf, Enerplus, Lumber 149-92-19D-18H,
    • 40529, conf, Enerplus, Curve 149-92-19D-18H,
    • 40528, conf, Enerplus, Dinger 149-92-19C018H,
    • 40527, conf, Enerplus, Juiced 149-92-19C-18H,
    • 40526, conf, Enerplus, Bullpen 149-92-19C-18H,
    • 40525, conf, Enerplus, Southpaw 149-92-19C-18H,
    • 40524, conf, Enerplus, Closer 149-92-19C-18H-LL,
  • Saturday, May 31, 2025: 54 for the month, 154 for the quarter, 368 for the year,
    • None.
  • Friday, May 30, 2025: 54 for the month, 154 for the quarter, 368 for the year,
    • 41202, conf, Silver Hill Energy Operating, Rooster W Federal 159-94-2-26-3MBHX,
    • 37577, conf, BR, Keene 21-2 TFH,

RBN Energy: the short- and long-term outlooks for Uinta waxy crude production. Archived.

We’ve discussed the qualities of the Uinta Basin’s unusual waxy crude, the challenges inherent in moving it to market, and the use of machine-learning AI to optimize its extraction from two key geologic layers or “benches” deep below the rugged hills of northeastern Utah. Now, in today’s RBN blog, it’s finally time to reveal what all this tells us regarding the prospects for continued Uinta production growth; the need for new takeaway capacity, blending and refining infrastructure to handle it; and — very important — the estimated duration of economically recoverable waxy crude under various price scenarios. 

This is the third blog in our series on how artificial intelligence (AI) is being used to assess and optimize the development potential of the Uinta Basin, which is now the fastest-growing crude-oil-focused production area in the U.S. on a percentage basis. In Part 1, we discussed the two flavors of Uinta waxy crude (black wax and yellow wax); their positive attributes (great for making high-value lubricants, low levels of sulfur and other impurities, and desirable yields of gasoil, kerosene, naphtha and other essential refined products); and initial production (IP) rates that match — and in some cases exceed — those in the best parts of the Permian.

We also described the challenges of storing and transporting waxy crude, the fast rise in Uinta production (now averaging more than 170 Mb/d), the demand from distant refineries and blenders, and the strain being put on existing midstream and downstream infrastructure. That’s all spurred talk of expansion projects, but E&Ps, rail terminal developers, refiners and blenders are wary of making big up-front investments without having a clear understanding of the Uinta’s long-term prospects and, with that, a high degree of confidence that the basin will remain economically productive long enough for their investments to pay off.

In Part 2, we examined the AI-based analytics our friends at Novi Labs use to (1) understand the individual contributions of a wide range of geologic and operational variables to production levels in the Uinta’s two most extensively drilled benches (Uteland Butte and Castle Peak), (2) employ that understanding to predict the performance of future wells in the two benches, and (3) forecast the volumes of waxy crude that could ultimately be extracted from these benches at various price points. Put simply — well, as simply as we can — Novi Labs’ machine-learning approach begins by gathering and incorporating a broad range of well-specific inputs (geologic, operational and spatial) on hundreds of drilled wells from public and proprietary sources. Novi then leverages the algorithms in the models it developed for each of the two benches, using reams of available data to gain a much deeper understanding of the relationships among and between these many variables and their impact on production outcomes.

In essence, machine learning integrates the wide range of data collected to recognize patterns and identify the primary drivers of well performance. It does this through the development and use of “Shapley values,” a game-theory concept that quantifies the contribution of individual input categories — more on that in a moment — to production from a given well compared to the average of the wells in the area. Machine learning then enables operators to assess how changing specific variables (such as drilling in a higher-pressure area, tightening well spacing, or increasing proppant intensity) would affect production outcomes in wells yet to be drilled. It also provides operators with guidance on how best to lay out, space, and sequence the development of the benches.

Today, we’ll build on the discussion about machine learning and Shapley values, compare the Uinta’s forecast productivity per well to the Permian and Bakken, and look at how much crude the wells in the Uinta’s key benches are likely to produce over time at various price points.

Novi Labs selected about 20 data points or variables (out of a broad set available to it) on hundreds of drilled wells in the Uteland Butte and Castle Peak benches that meet its criteria (at least 90 days of production and values for proppant, completion fluid and lateral length). The geologic data includes things like porosity, total organic carbon (TOC), lithology (the physical and chemical characteristics of the rock) and pressure, plus depth, structural position within the basin and proximity to faults. The operational data, in turn, includes factors such as proppant intensity, fluid volume per foot, stage spacing, lateral length, and the precise placement of the lateral within the bench.

Impact of Proppant Intensity on Uteland Butte Production

Impact of Proppant Intensity on Uteland Butte Production

Figure 1. Impact of Proppant Intensity on Uteland Butte Production. Source: Novi Labs 

Monday, June 17, 2024

The Area Under The Curve -- June 17, 2024

Locator: 47869ECON.

So much for all that talk about personal debt.  

Area under the curve.

Link here.


Wednesday, February 7, 2024

Demographics Again -- February 7, 2024

Locator: 46762DEMOGRAPHICS.

I talk about demographics occasionally -- see this link.  

Now, this, from today's WSJ:


From the linked article:

More Americans are turning 65 this year than any prior time in history.

About 4.1 million Americans will reach 65 years old this year, reaching a surge that will continue through 2027, according to an analysis by Jason Fichtner, executive director of the Retirement Income Institute and chief economist at the Bipartisan Policy Center. That is about 11,200 a day, compared with the 10,000 daily average from the previous decade, he says.

Today’s 65-year-olds are wealthier than their predecessors. While significant disparities exist, the median net worth of those 65 to 74 was $410,000 in 2022, up from $282,270 in 2010 in inflation-adjusted 2022 dollars, according to the Federal Reserve’s Survey of Consumer Finances.

Now put that story and the charts "against" "my favorite chart." LOL. This is not rocket science. 

And, then, of course, "that area under the curve."

Wednesday, December 20, 2023

Housing, Consumer Confidence -- December 20, 2023

Locator: 46357ECON.

Think:

  • "area under the curve"
  • MMF chart
  • nice run in equities, 2023
  • bonuses for folks coming back to work
  • salaries for AI employees
  • UAW contract
  • foreign investment
  • folks moving out of California to Texas, Idaho
  • opportunity to re-finance

Link here.

Sales of previously owned homes unexpectedly inched up in November, 2023, snapping a five-month slump and ending a 13-year low. Don’t call it a rebound just yet, says one industry economist. 

Existing homes in November were sold at a seasonally adjusted annual rate of 3.82 million, up 0.8% from the prior month. 

*************************************
Consumer Confidence Surges

Americans are wrapping up 2023 feeling better about the economy, with consumer confidence surging past expectations.

The Conference Board’s consumer confidence index jumped to 110.7 in December from November’s downwardly revised 101 reading. 

Economists were forecasting it would tick up to 104.5.

The outlook for the next six months also improved, with the expectations index, which measures the short-term outlook for the economy, rising to 85.6 from 77.4. Americans are also more optimistic that the economy will avoid a recession within the next year.

Wednesday -- Four Full Days Of Brick And Mortar Shopping -- December 20, 2023

Locator: 46355ECON. 

The big stories today:

  • Bull market
  • Americans continue to spend; the area under the curve;
  • FedEx

***************************
Bull Market

Link here.

 ***************************
Area Under The Curve

From twitter; from CNBC.

From the blog: one year ago, 100% probability of a recession within twelve months -- predicted in October, 2022.

**************************
A Straight Line


*************************************
FedEx

FedEx competitors. They must be measuring / comparing a category of which I'm unfamiliar but I don't see Amazon at the webpage.

From CNBC today: shares fall 9% in pre-market trading. Folks seem surprised. When was the last time you sent a Christmas gift by FedEx. 

Here we go:

Pre-market:

Disclaimer: this is not an investment site. Do not make any investment, financial, job, career, travel, or relationship decisions based on what you read here or think you may have read here. 

All my posts are done quickly: there will be content and typographical errors. If anything on any of my posts is important to you, go to the source. If/when I find typographical / content errors, I will correct them. 

Again, all my posts are done quickly. There will be typographical and content errors in all my posts. If any of my posts are important to you, go to the source.

Saturday, December 16, 2023

Interactive Inflation Graphic -- December 16, 2023

Locator: 46318ECON.

Link here. Tag inflation chart graphic.

At the link scroll down to the graphic and then click on the sector at the legend to the right of the graph.

I don't think any of these graphs make me a better investor but it helps me fact-check the talking heads on CNBC and helps put things in better perspective.  

Farther down on that same page, the CPI since 1913.

Looking at the last column: average annual percent change -- "AVG - AVG":

  • 2019: 1.8%
  • 2020: 1.2% -- Covid-19 lockdown
  • 2021: 4.7% -- Covid-19 lockdown
  • 2022: 8.0% -- "area under curve" meets "supply chain woes"; inflation spike had very little to do with anything else
  • 2023: 3.5%? -- Fed,other analysts foresee change around 2% going into 2024 - 2025

Important to note:

  • "area under the curve": well understood
  • "supply chain woes": has never been adequately explained to average investor

So, we had one year of a spike to 8% coming off something we had never seen before: "area under curve" meets "supply chain woes."

And worse, the "supply chain woes" were exacerbated by challenges of the Fourth Industrial Revolution.

So, a one year spike.

We have had it worse: look at the period from 1968 to 1991 -- 23 years.

Much, then, derives from that. 

I think it's fascinating.

It doesn't make me a better investor but it reassures me I'm on the right track.

It also speaks volumes about CEOs who say they are struggling due to inflation.  

Which brings me to Mary Barra and another stand-alone post later.

Friday, December 15, 2023

Headlines -- December 14, 2023

Locator: 46306CHINA. 

Last observation: before heading to bed -- midnight, December 14, 2023 ... my favorite color at Christmas -- green:

Bakken: a reader noted that after years (?) of "no activity" in the Bakken, XTO now has an active rig in the state. A huge "thank you" to the reader who alerted me to that observation.

China: all that talk about the cratering Chinese economy -- oh, give me a break. Link here.

Smucker: I mentioned Smucker on the blog on December 5, 2023, but unfortunately, I forgot to provide the link and I don't recall what Smucker was doing that caught my attention. 

I don't have a position in SJM and doubt that I ever will but that doesn't mean Smucker is not worth. Explore it on your own; I don't have time to post much on it tonight
What happened tonight that brought me to JMSmucker. It was Café Bustelo. I saw this in my daughter's kitchen. My son-in-law bought it -- probably at Walmart -- some months ago when coffee was hard to come by due to Covid-related supply chain issues. It is now my wife's favorite coffee when she visits the twins in Portlan, Oregon.

So, what's with Café Bustelo. It turns out Café Bustelo is a JMSmucker brand. From the JMSmucker coffee brand site: 


From Motley Fool, September, 2023. 

***************************
Restaurants

Updates

December 15, 2023: completely unexpected --

Original Post

 The tea leaves suggest we're going to see a lot of regional fast-food and sit-down restaurants start to fail over the next couple of years. Anecdotal, based on what I'm seeing in our north Texas neighborhood, a suburb of Ft Worth / Dallas. 

I think this guy is wrong on the specifics but not the generalities. Link here. He assumes there will be a recession / hard landing.

********************************
In-N-Out

One that won't fail: In-NOut.

Link here. First In-N-Out  the state of Idaho recently opened. Outrageous video.

***************************
EIA Accounting

Link here. 

***************************
Trans Mountain Pipeline Delay

I'm not going to waste time looking for a link -- the link is easy to find -- but it's possible that the pipeline -- scheduled after years of delays to be operational in the next month or so, may now be delayed another two years and another billion dollars or more in overrun costs due to regulators -- bureaucrats who think they understand drilling better than the operators. As long as I don't have a dog in the fight, I don't care. Here's a link: I had to look up something.

*****************************
Hope Springs Eternal

Pending:

  • OXY: CrownRock
  • CVX: Hess
  • XOM: PXD

Headline: "Consolidation Push Could Turn US Oil Industry Into Handful Of Giants." 

Not if the FTC can help it.

******************************
The Area Under The Curve

I still need to talk about "the area under the curve," but I don't have the energy or interest to do it tonight.

Link here for a tease.

*****************************
The Fourth Industrial Revolution


I don't have the energy or interest to write about 4IR either, but here's one article about which to think with regard to 4IR.

********************************
GM EVs

OMG. Ready to spend more time with her family?

Link here.

Wednesday, December 13, 2023

Area Under The Curve -- December 3, 2023

Locator: 46294ECON.

Updates

December 13, 2023: Powell's explanation. 

Area under the curve.

Original Post 

"Area under the curve." It continues to explain a lot.

Thursday, October 26, 2023

Breaking News On US Economy -- Surge In Growth -- Area Under The Curve -- WSJ -- October 26, 2023

Locator: 45841ECON. 

Drudge doesn’t often put headlines in RED, but in this case US GDP caught so many folks oft-guard, he put the news in RED. Bidenomics?

The reason for the GPD growth, from The WSJ: "area under the curve." LOL:

 From CNBC: 

Link here.

Earlier, from The WSJ:


For the US:

 Others:

Note: wikipedia's most recent estimate for the US was $26.854 trillion; now two days ago, October 24, 2023, the estimate for US GDP has increased to $26.94 trillion. In percentages, about the same but in raw dollars, not trivial. At least in my mind.

*****************************
US Debt vs GDP

With all the economic data coming out today, I was curious to see US debt vs GDP ddat.

From tradingeconomics:


As a percentage, US debt has remained fairly constant in the past two years and actually dropped in 2021 year/year.

I forget, who was president in 2020?

Who was president for the past two years when the ratio initially dropped but has, for the most part, stayed constant?

Saturday, October 21, 2023

One Year Ago: 100% Probability Of A Recession Within Twelve Months -- Bloomberg -- October 21, 2023

Locator: 45781ECON. 

The Fed: to move from 3% to 2% inflation, the Fed will kill the housing sector, the auto industry and renewable energy.  

JPow's memoirs title: Doing It My Way: The Operation Was A Success But The Patient Died.

Mester's memoirs title: No Regrets: How We Stopped Renewable Energy.

***********************
The Economy

One year ago, Bloomberg Economics predicted with a 100% probability a recession within 12 months.

100% probability.  

100% probability.  

So, what happened?

***********************
The Blog

The area under the curve:

This, the area under the chart, without a doubt, the largest ever in the history of mankind.

My favorite chart.

Link here.


******************************
Transfer of Wealth -- Already in Play

Now, let's add another data point: the greatest wealth transfer in the history of mankind. Link here.

My parents' generation transferred to me and my generation: $16 trillion.

My generation will transfer to the next two generations, our children, Gen X and Gen Y: $53 trillion.

First off all, I can't get my mind around one trillion dollars, much less $15 trillion, much less $60 trillion.

This transfer has only just begun.

My generation, the baby boomers: 1946 - 1964.

Today: ages 77 years of age - 59 years of age.

***************************
RMDs

Baby boomers: first generation with tax-deferred (and tax-exempt) IRAs.

IRS changed the rules and now inherited tax-deferred IRAs must be exhausted in ten years.

The phenomenon of RMDs from the baby boomers has also just begun.

Age 73: must begin to take RMDs from IRAs.

Human nature: most folks who have sizeable IRAs and understand investing will try to wait as long as they can to start taking their RMDs each year. So, now, we're coming to the end of the year, and the holidays are coming. RMDs for 2023 start to hit their stride now.

***************************
Housing

Baby boomers: big families. Common for folks like me to have four, five, or six siblings. But, Gens X, Y, and Z will have youngsters with zero or one sibling and that's it. 

Much less money being spent on housing (high interest rates, also, of course, but less money on housing translates into more money in non-housing retail sector.

Link here. 

***********************
Transportation

Due to high cost of automobiles, shortage of vehicles, etc., folks spending a lot less on autos. That leaves a lot more money for non-auto retail sales.

Excluding autos, sales were up 0.6%, also well ahead of the forecast for just 0.2%. The so-called control group, which strips out items such as auto dealers, gas stations, office supply stores, mobile homes and tobacco stores and is used for the department’s GDP calculation, rose 0.6% as well.

***********************
Disposable Income

In the US, averages $50,000 per capita. Previously reported. Link provided by a reader, thank you.

**********************
Bottom Line

From the linked CNBC article:

 “The U.S. consumer cannot stop spending,” said David Russell, global head of market strategy at TradeStation.
“All three retail sales reports for Q3 were above estimates, which puts us on track for a strong GDP number later this month. It also gives the Fed zero reason to loosen policy, which keeps the 10-year Treasury yield pushing toward 5%.”
Sales gains were broad-based on the month, with the biggest increase coming at miscellaneous store retailers, which saw an increase of 3%.
Online sales rose 1.1% while motor vehicle parts and dealers saw a 1% increase and food services and drinking places grew by 0.9%, good for a yearly increase of 9.2%, which led all categories.
There were only a few categories that showed a decline; electronics and appliances stores as well as clothing retailers both saw decreases of 0.8% on the month.

*************************
GDPNow

Link here.

Estimates for 3Q23 coming in at 5.4%.

Tuesday, October 17, 2023

Retail Sales Rose Almost 4x That Forecast In September -- October 17, 2023

Locator: 45800ECON. 

Big winners? Banks, today, are reporting huge earnings on interest payments for the third quarter, July - September, 2023, off strong retail sales. Investors worried the Fed will not simply be "higher for longer, but "much higher for longer." Link to WSJ.

Link here.

Let's review some charts.

The area under the curve:

This, the area under the chart, without a doubt, the largest ever in the history of mankind.

My favorite chart.

Link here.


******************************
Transfer of Wealth -- Already in Play

Now, let's add another data point: the greatest wealth transfer in the history of mankind. Link here.

My parents' generation transferred to me and my generation: $16 trillion.

My generation will transfer to the next two generations, our children, Gen X and Gen Y: $53 trillion.

First off all, I can't get my mind around one trillion dollars, much less $15 trillion, much less $60 trillion.

This transfer has only just begun.

My generation, the baby boomers: 1946 - 1964.

Today: ages 77 years of age - 59 years of age.

***************************
RMDs

Baby boomers: first generation with tax-deferred (and tax-exempt) IRAs.

IRS changed the rules and now inherited tax-deferred IRAs must be exhausted in ten years.

The phenomenon of RMDs from the baby boomers has also just begun.

Age 73: must begin to take RMDs from IRAs.

Human nature: most folks who have sizeable IRAs and understand investing will try to wait as long as they can to start taking their RMDs each year. So, now, we're coming to the end of the year, and the holidays are coming. RMDs for 2023 start to hit their stride now.

***************************
Housing

Baby boomers: big families. Common for folks like me to have four, five, or six siblings. But, Gens X, Y, and Z will have youngsters with zero or one siblings, and that's it. 

Much less money being spent on housing (high interest rates, also, of course, but less money on housing translates into more money in non-housing retail sector.

Link here. 

***********************
Transportation

Due to high cost of automobiles, shortage of vehicles, etc., folks spending a lot less on autos. That leaves a lot more money for non-auto retail sales.

Excluding autos, sales were up 0.6%, also well ahead of the forecast for just 0.2%. The so-called control group, which strips out items such as auto dealers, gas stations, office supply stores, mobile homes and tobacco stores and is used for the department’s GDP calculation, rose 0.6% as well.

***********************
Disposable Income

In the US, averages $50,000 per capita. Previously reported. Link provided by a reader, thank you.

**********************
Bottom Line

From the linked CNBC article:

 “The U.S. consumer cannot stop spending,” said David Russell, global head of market strategy at TradeStation.
“All three retail sales reports for Q3 were above estimates, which puts us on track for a strong GDP number later this month. It also gives the Fed zero reason to loosen policy, which keeps the 10-year Treasury yield pushing toward 5%.”
Sales gains were broad-based on the month, with the biggest increase coming at miscellaneous store retailers, which saw an increase of 3%. Online sales rose 1.1% while motor vehicle parts and dealers saw a 1% increase and food services and drinking places grew by 0.9%, good for a yearly increase of 9.2%, which led all categories. There were only a few categories that showed a decline; electronics and appliances stores as well as clothing retailers both saw decreases of 0.8% on the month.

*************************
GDPNow

Link here.

Estimates for 3Q23 coming in at 5.1%.

Next estimate will be released later today: released — rises again, now, 5.4%.