RBN Energy: Bakken production has been stuck in neutral, but producers aren't giving up. Link here.Archived.
Of
all the hydrocarbon-producing basins in the U.S., the Bakken is the one
that generates the most concern that its crude oil core may be
exhausted. Rig counts and production have flatlined, and the basin’s
share of Lower 48 horizontal oil production has been more than halved,
from 26% in 2016 to 12% in 2026. In today’s RBN blog, we show that while
production is off its highs, operators aren’t giving up on the area.
Instead, they are compensating with longer laterals and greater drilling
efficiency.
Today’s blog is part of our ongoing series on U.S. basins and also teases Novi’s latest Q4 2026 report on the Williston Basin.
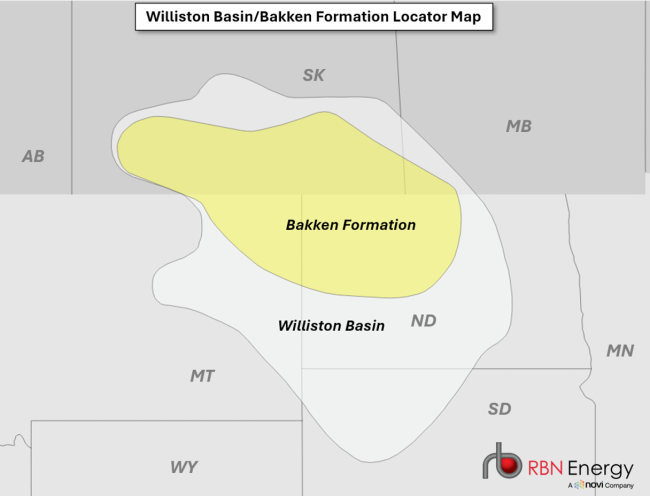
The Williston (white-shaded area in Figure 1 below) is a huge
geological basin of roughly 300,000 square miles, spanning parts of
western North Dakota, eastern Montana, northwestern South Dakota, and
the Canadian provinces of Saskatchewan and Manitoba.
Figure 1. Williston Basin/Bakken Formation Locator Map. Source: Novi Labs
The
Bakken formation (yellow-shaded area) within the Williston is broken
into three sections — the Middle Bakken is a rock formation that sits
between the Upper and Lower Bakken shale layers. Three Forks is a
separate geological formation directly beneath the Bakken. The center of
the Bakken refers to the geographic core of the Bakken play, where some
of the most productive acreage is concentrated. (One note on
terminology: Novi Labs refers to it as the Williston because its report
covers the geology of the whole basin, not just one formation. We
typically call it the Bakken because that’s the name much of the
industry uses and the Bakken formation accounts for most of the basin’s
production.)
It appears the site has pretty much shut down. This is today's banner and it's the only data block that is being updated or so it seems.
Daily CO2:
this year, November 18, 2026: 428.55
last year, November 18, 2025: 426.57
For some reason, the last February data was in 2025. The "December Temperature" data does not provide the year but it is obviously December, 2024. For more current data, link here.
************************************************ Previous Data
Everything below this line was from November 16, 2025, one year ago:
Why they leave up "February CO2" is beyond me but that hasn't changed ... well, since February, 2024.
December
Temperature? What's that all about? Obviously that's December, 2024 --
almost a year ago. This is the reason they go back to 1880 - 1920:
Considering
all the coal that China is burning, I just can't get too excited about
these numbers. In fact, if we're talking only 1.55°C since 1900, an
increase of 1.55°C over 125 years isn't all that remarkable. Also, it
appears that the number for February, 2025, was 427.09 compared with a
most recent reading of 428.29 for November, 2025. I doubt that is
statistically significant nor repeatable (if they were to test again).
All
in all, this is really a pretty amateurish website considering the
billions of dollars the sponsors are demanding from western nations
************************************* A Great Map To Use To "Learn" The States