Many, many data points and many graphics, of course. This one is most interesting -- note that the "outlook" goes out to 2050. It appears that the EIA assumes that California, Washington (state), North Carolina, Maine, et al will ban off-shore drilling and that Alaska will be less than extraordinary. I assume much of the "other" (dark brown) is from the Gulf of Mexico.
The other thing that jumps out at me is in the graphic to the left, the "reference" case. That graphic includes data from 2000 to 2016 (which the two graphics to the right do not): look how much crude oil from shale jumped from 2000 (less than 1 million bopd) to 2016 (almost 6 million bopd). By 2050, the amount of crude oil from shale could more than double (from about 6 million bopd to 15 million bopd).
FindTheHome, a real estate intelligence site, set out to find the pizza capitals of America. Using Yelp's API, Yelp Fusion,
the data scientists calculated an aggregate "Pizza Score" for all
cities with at least 100,000 people.
They used three sub-metrics to
measure pizza prevalence, inherent quality and quality compared to other
types of food. Those three metrics include:
- Prevalence: The total number of pizza restaurants in a given city
- Inherent Quality: The percentage of pizza restaurants in a given city rated with four or more stars
- Quality Compared to Other foods: The average Yelp rating of pizza restaurants in a given city compared to the average rating of all restaurants in that city
FindTheHome
compared the average scores of pizza restaurants to other non-pizza
restaurants to ensure that the cities on the list sell pizza that stands
out in comparison to other types of food — think Chinese or Mexican
food. The list is ranked by the Pizza Score, with the highest score
being the No. 1 pizza capital in America. When ties occur, the cities
are ordered according to the average rating for pizza restaurants in
that city.
At the bottom of my spreadsheet, the things that jumped out at me.
I added a fourth column that was not in the original poll. Assuming that you were an out-of-town visitor, what are the chances, not knowing anything about the pizza restaurants in town, what are the chances that you would end up at a bad pizza restaurant (actually pretty high, ranging from 24% to 66%)? By that criteria, Philadelphia should have been ranked #1: of all the cities, an out-of-town visitor would be more likely to pick a 4-star or 5-star pizza restaurant than in any other city listed. Chicago and NYC are ranked #1 and #2 respectively but 66% of pizza restaurants in both cites are 3-star or worse. The cities below are ranked #25 at the top to #1 at the bottom:
City
# of pizza restaurants
# of 4 - 5 star pizza restaurants
Percent chance of finding a bad pizza restaurant
Louisville/Jefferson County, KY
60
27
55%
Mesa, AZ
108
35
68%
Lexington-Fayette, KY
93
45
52%
Chattanooga, TN
38
22
42%
Charlotte NC
164
55
66%
Knoxville, TN
70
28
60%
Stockton, CA
58
25
57%
Los Angeles, CA
799
318
60%
Berkeley, CA
40
22
45%
Tucson, AZ
126
45
64%
Scottsdale, AZ
83
38
54%
Colorado Springs, CO
95
32
66%
Irvine, CA
44
19
57%
San Diego, CA
385
163
58%
Oklahoma City, OK
128
53
59%
Columbus, OH
108
62
43%
El Paso, TX
67
36
46%
Raleigh, NC
125
59
53%
Portland, OR
226
105
54%
Jacksonville, FL
192
75
61%
Seattle, WA
226
110
51%
Philadelphia, PA
87
66
24%
Phoenix, AZ
330
131
60%
NYC, NY
1795
697
61%
Chicago, IL
437
171
61%
Comments:
Boston did not make the list! It's a bogus poll if Boston did not make the list
not one city in New Jersey! It's a bogus poll if no city in New Jersey was on the list
fly-over states? where are they?
Tennessee/Kentucky over-represented? Interesting. Not expected.
Summary (look at these initial production numbers -- wow!):
ECA has 9 horizontals
producing over 300 MBO since January of 2016, and a large number that
model over 300 MBO within the first year of well life
ECA has had
several recent locations at or well above the high end of its average,
proving well design can continue to improve EURs
a comparison of
2015 wells with those completed in 2016 or after shows an increase in
oil production of 54 MBO in the first 16 months of well life
The biggest improvements have been seen in Texas. The Permian and Eagle
Ford have seen record wells, and production numbers well above the high
end locations just a year or two ago.
The issue seems to be how high the
bar can be set. Operators are now focused on stimulating each foot in
the best manner, and this has helped to keep US production high in the
face of lower oil prices. Everyone continues to wonder if shale can keep
oil prices lower for longer, or if OPEC can control prices.
Recent
wells by Encana show a massive improvement. This is the case for many US operators, and seems to be industry wide.
This is most interesting. One can read this Bloomberg article many, many ways (link below).
I read it this way: the faux environmentalists are starting to walk back their wild claims that anthropogenic global warming will mean the end of earth as we know it.
Probably not going to happen, though this was predicted in 2008 or thereabouts:
It's behind a paywall, but if you don't subscribe to Bloomberg you should be able to access it by googling key phrases from the article.
There are some 20,000 research papers listed on Google Scholar, a
search engine for academics, that mention the worst-case scenario for
climate change, one where an overpopulated, technology-poor world digs
up all the coal it can find. Basically, it’s the most cataclysmic
estimate of global warming.
This
scenario is important to scientists. It focuses minds on the
unthinkable and how to avoid it.
According to a provocative new analysis
from the University of British Columbia, it’s also wrong.
The scientific reference:
The new work, published this week in Environmental Research Letters,
shows just how much all that phantom coal may be distorting our picture
of what the future may look like. It casts “doubt on whether this
outlook is still valid,” the researchers write.
The worst-case
scenario is one of four siblings. Their names, from bad to worst, are
RCP2.6, RCP4.5, RCP6.0 and RCP8.5. They were introduced in 2011 as a way
for researchers running different climate-economic models to do
comparable studies regarding how high greenhouse gas concentrations
might rise by 2100.
These four storylines range from a 2100 in
which aggressive global climate policy leads to low warming, to one in
which humanity digs up and burns anything that’ll catch fire.
One
big problem with the amount of coal burning assumed by RCP8.5 is that
there’s probably not enough extractable coal to make the scenario
possible. “We don’t think it’s going to happen,” said Justin Ritchie,
lead author of the University of British Columbia study and a Ph.D.
candidate. “That’s extremely unlikely and also inconsistent with every
year since the late 19th century.” [Best example of faux environmentalists walking back their most extreme predictions.]
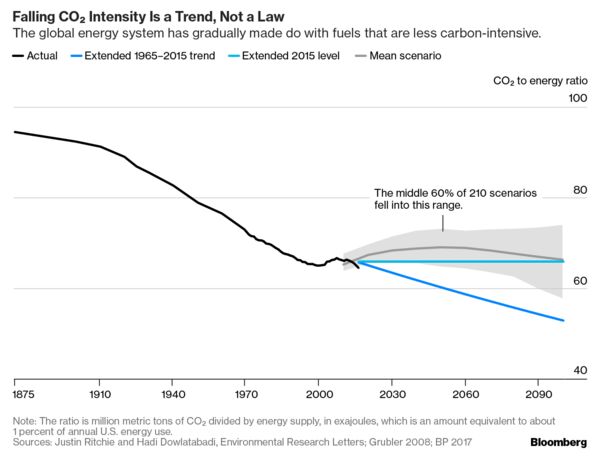
A key graphic:
More from the article:
The 2015 Paris Agreement called for limiting warming to from 1.5 degrees
to 2 degrees Celsius (3.6 degrees Fahrenheit). Global average
temperatures have already risen almost 1C in the past century. The 1.5C
goal may already be impossible, and 2C would require major emissions
reductions and, later this century, technological advances to pull
enough carbon out of the air.
The disconnect between the historical decarbonization trend
and the demands of RCP8.5 shed light on the often-ignored foundation of
the world’s climate goals: the baseline.
Paying attention to climate
goals without studying optimal baselines is like watching the end of a
marathon without knowing where or when it started.
The article is quite long; it's a must read (if you can get to it).