Doomscrolling: I think folks know the meaning of this word. Two magazines to which I subscribe are essentially "doomscrolling" media: The New Yorker and Harper's.
It seems the bulk of New York Times articles that end up in my newsfeed are meant for doomscrollers. I'll be canceling (not renewing) my subscriptions to both The New Yorker and Harper's. At age 75+ I don't have time for doomscrolling, and I certainly don't need to pay for it. I can still access the headlines and then use AI to access a summary of the articles if necessary.
The three most influential men alive today: President Trump, Jensen Huang, and Elon Musk.
Anticipation:
****************************** Back to the Bakken
WTI: $98.06.
New wells reporting:
Tuesday, September 22, 2026: 46 for the month, 126 for the quarter, 483 for the year,
41723, conf, BR, HBU Hazel 5N MBH,
Monday, September 21, 2026: 45 for the month, 125 for the quarter, 482 for the year,
41730, conf, BR, HBU Hazel 9S MBH,
Sunday, September 20, 2026: 44 for the month, 124 for the quarter, 481 for the year,
41722, conf, BR, HBU Hazel 4N MBH,
Saturday, September 19, 2026: 43 for the month, 123 for the quarter, 480 for the year,
42026, conf, Oasis, Milkweed 5302 14-36 3B,
41729, conf, BR, HBU Hazel 8S MBH,
41639, conf, BR, HBU Badlands 10S MBH-ULW,
RBN Energy: how pipeline flow data can help you pull meaning from complex natural gas markets. Link here. Archived.
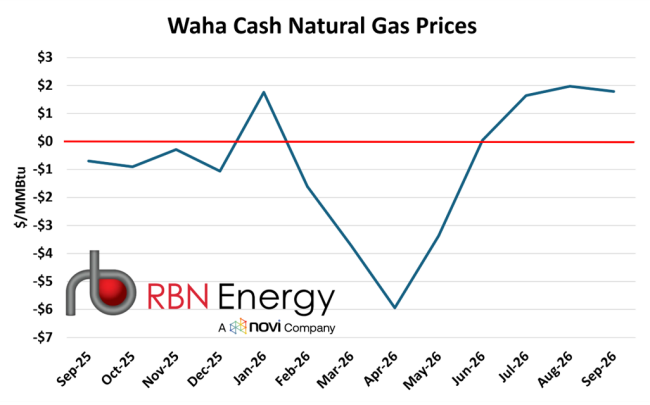
Natural gas prices at the Waha Hub in West Texas averaged below
zero every month between September 2025 and May 2026, except January,
then shot back above zero in mid-June as the Gulf Coast Express
expansion began service. With Hugh Brinson now online as well and even
more capacity coming in the years ahead, the basin has likely seen the
last of negative prices for years to come. But how can we be sure the
region has sufficient takeaway capacity? Or more importantly, how can we
identify where or when the next potential bottleneck might be? In
today’s RBN blog, we’ll highlight the importance of gas-flow analysis
and pipeline modeling. Today’s blog also serves as an unabashed preview
of our upcoming Natural Gas Master Class, an online-only event to be held Wednesday, October 21.
Given
the rapid buildout of natural gas pipelines in recent years, with more
on the way, understanding gas flows has never been more crucial. The
ability to read pipeline data, model regional production and forecast
market shifts is what separates accurate analysis from guesswork. As
more and more gas flows toward the Gulf Coast to serve LNG export
demand, understanding shifting flow dynamics and localized market
constraints has become increasingly important to understanding the big
picture of U.S. energy markets as well as global gas markets. An
incredible amount of data is available, unlocking real-time market
information, but you have to know how to read and interpret it.
As we wrote in Open The Door,
Permian gas production had been constrained until recently, causing
negative cash prices in the basin for some time before the Gulf Coast
Express expansion began service. The basin produces massive amounts of
associated natural gas, but because of its location in West Texas and
southeastern New Mexico there is almost no local market to serve. Nearly
all the production in the basin is consumed elsewhere, and that
requires massive pipeline takeaway capacity.
The
U.S. has two different types of pipelines, interstate (those that cross
state lines) and intrastate (those that don’t). Nearly all of the
buildout already online and still coming in the Permian is comprised of
intrastate pipelines, which are not regulated by the Federal Regulatory
Energy Commission (FERC). Intrastate pipelines have to report far less
data than the pipelines that cross state lines and don’t report any flow
data, and often companies don’t even announce that a project has come
online until well after the fact. So, given the lower reporting
requirements, how do we even know that the Gulf Coast Express expansion
or Hugh Brinson are online?
We can see it in the
market, in the price response and pipeline flow response of connected
infrastructure. Let’s start with Gulf Coast Express, which took the
market from constrained to unconstrained and is obvious to see — if you
know what to look for. First, from a pricing perspective, in just a few
days this summer, Waha cash prices (blue line in Figure 1 below) went
from less than negative $1/MMBtu to above $1.50/MMBtu. Prices averaged
just above zero (horizontal red line) in June and have been largely
between $1.50/MMBtu and $2/MMBtu since July.
Figure 1. Waha Cash Natural Gas Prices. Source: Natural Gas Intelligence