Showing posts sorted by relevance for query DUCs. Sort by date Show all posts

Saturday, July 14, 2018

Wells Off Line For Operational Reasons

Locator: X456B.
Updates: The Raw Data

October, 2023: some data pending:September, 2023: some data pending.

  • completed: 96 (preliminary)
  • inactive:
  • DUCS:
  • total off line for operational reasons: 
  • producing:

September, 2023: some data pending:September, 2023: some data pending.

  • completed: 129 (preliminary)
  • inactive: 1,547
  • DUCS: 367
  • total off line for operational reasons: 1,914
  • producing:18,538

August, 2023: some data pending.

  • completed: 91 (preliminary)
  • inactive: 1,624
  • DUCS: 376
  • total off line for operational reasons: 2,000
  • producing: 18,396

July, 2023:

  • completed: 83 (preliminary)
  • inactive: 1,665
  • DUCS: 419
  • total off line for operational reasons: 2,084
  • producing:18,179 (preliminary) -- new all-time highh

June, 2023:

  • completed: 85 (preliminary)
  • inactive: 1,693 -- compare with last month
  • DUCS: 433
  • total off line for operational reasons: 2,216
  • producing:18,085

May, 2023:

  • completed: 138 (preliminary)
  • inactive: 1,779
  • DUCS: 459
  • total off line for operational reasons: 2,238
  • producing: May, 2023: 17,913 (new all-time high)

April, 2023:

  • completed: 51 (preliminary)
  • inactive: 1,899
  • DUCS: 458.
  • total off line for operational reasons: 2,357
  • producing: 17,768

March, 2023: some data pending

  • completed: 62 
  • inactive: 1,900.
  • DUCS: 483.
  • total off line for operational reasons: 2,383
  • producing:17,656.

February, 2023:

  • completed: 96
  • inactive: 1,900.
  • DUCS: 487.
  • total off line for operational reasons: 2,387
  • producing: 17,506

January, 2023:

  • completed: 67 (preliminary)
  • inactive:1,998 (a 24% decrease m/m)
  • DUCS: 469 (a 4% increase)
  • total off line for operational reasons: 2,467 (a 19% decrease)
  • producing:17,366 (an increase of 0.7%)

December, 2022:

  • completed: 104
  • inactive: 2,613 (an increase of 15%)
  • DUCS: 450 (a less-than- 1% decrease)
  • total off line for operational reasons: 3,063 (a 13% increase)
  • producing:17,233 (a decrease of 2%)

November, 2022:

  • completed: 58
  • inactive: 2,271 (a decrease of 20%)
  • DUCS: 447 (a 9% decrease)
  • total off line for operational reasons: 2,718 (a 14% increase)
  • producing:17,580

October, 2022:

  • completed: 54 (preliminary; a 47% decrease)
  • inactive: 1,886 (a 30% increase)
  • DUCS: 489 (3% increase)
  • total off line for operational reasons: 2,375 (a 24% increase)
  • producing:17,791 (revised, final; a new all-time high)

September, 2022:

  • completed: 81 (preliminary; a 22.7% increase)
  • inactive:1,447 (decreased by 267; decreased by 15.5%)
  • DUCS: 474 (decreased by 3; decreased by 0%)
  • total off line for operational reasons: 1,921 (decreased by 12.3%)
  • producing:17,769 (increased by 53, increased by 0.9%)

August, 2022:

  • completed: 66 
  • inactive:1,714 (increased by 49; increased by 2.9%)
  • DUCS: 477 (increased by 12; increased by 2.6%)
  • total off line for operational reasons: 2,191 (decreased by 12%)
  • producing:17,616 (increased by 235, increased by 1.4%); revised, 17,632.

July, 2022:

  • inactive: 1,655
  • DUCS: 465
  • total off line for operational reasons: 2,120
  • producing:17,381

June, 2022: has recovered from the April blizzard

  • inactive: 1,750
  • DUCS: 483
  • total off line for operational reasons: 2,233
  • producing: 17,284

May, 2022:

  • inactive: 2,448
  • DUCS: 496
  • total off line for operational reasons: 2,944
  • producing: 16,965

April, 2022: huge blizzard shut things down

  • inactive: 1,909
  • DUCS: 494
  • total off line for operational reasons: 2,403
  • producing: 16,896

March, 2022:

  • inactive: 1,928
  • DUCS: 451
  • total off line for operational reasons: 2,379
  • producing: 16,746

February, 2022:

  • inactive: 1,872
  • DUCS: 463
  • total off line for operational reasons: 2,335
  • producing: 16,746

January, 2022: 

  • inactive: 2,420
  • DUCS: 449
  • total off line for operational reasons: 2,869
  • producing: 16,865 (final)

December, 2021: 

  • inactive: 1,975
  • DUCS: 475
  • total off line for operational reasons: 2,450
  • producing: 17,200 (revised -- new all-time high)

November, 2021: 

  • inactive: 1,957
  • DUCS: 416
  • total off line for operational reasons: 2,373
  • producing: 17,245 (new all-time high)

October, 2021: 

  • inactive: 1,881
  • DUCS: 457
  • total off line for operational reasons: 2,338
  • producing: 17,163 (preliminary -- new all-time high)

September, 2021: 

  • inactive: 1,696 
  • DUCS: 503
  • total off line for operational reasons: 2,199 
  • producing: 17,51 (final-- new all-time high)
August, 2021:
  • inactive: 1,672
  • DUCs:  521
  • total off line for operational reasons:  2,193
  • producing: 16,956 (looks like a new all-time high)

July, 2021:

  • inactive: 2,082
  • DUCs: 521
  • total off line for operational reasons: 2,603
  • producing: 16,844 (preliminary; all-time high, last month, June, 2021, with 16,844)

June, 2021 (final):

  • inactive: 1,839
  • DUCs: 680
  • total off line for operational reasons: 2,519
  • producing: 16,844 (all-time high)

May, 2021:

  • inactive: 2,348
  • DUCs:  677
  • total off line for operational reasons: 3,025
  • producing: 16,623

April, 2021:

  • inactive: 2,088
  • DUCs: 731 (note: this is an increase from the month before)
  • total off line for operational reasons: 2,819
  • producing: 16,374 (preliminary)

March, 2021:

  • inactive: 2,351
  • DUCs: 628
  • total off line for operational reasons: 2,979
  • producing: 16,212 (final)

February, 2021:

  • DUCs: 662
  • inactive: 2,568
  • total off line for operational reasons: 3,230
  • producing: 15,773 (preliminary)

January, 2021:

  • DUCs: 661
  • inactive: 2,597
  • total off line for operational reasons: 3,258
  • producing: 15,798 (preliminary)

December:

  • DUCs: 668
  • inactive: 2,687
  • total off line for operational reasons: 3,355 
  • producing: 15,798 (preliminary) 

November:

  • DUCs: 710
  • inactive: 2,870
  • total off line for operational reasons: 3,580 
  • producing: 15,601 (preliminary); 15,620 (revised)

October:

  • DUCs: 724
  • inactive: 2,934
  • total off line for operational reasons: 3,658  
  • producing: 15,512 (preliminary); 15,601 (revised)

September:

  • DUCs: 793
  • total off line for operational reasons: 4,542 
  • producing: 15,377 (preliminary) --> 15,389 (final)

August, 2020:

  • DUCs: 846
  • inactive well count: 2,719
  • total off line for operational reasons: 3,565

July, 2020:

  • DUCs: 878
  • inactive well count: 3,762
  • total off line for operational reasons: 4,640

June, 2020:

  • DUCs: 899
  • inactive well count: 4,214
  • total off line for operational reasons: 5,113

May, 2020:

  • DUCs: 962
  • inactive well count: 6,108
  • total off line for operational reasons: 7,070

April, 2020:

  • DUCs: 944 (down 28 from the 972 in March)
  • inactive well count: 2,168 (up 7 from 2,161 in March)
  • total off line for operational reasons: 3,112
March, 2020:
  • DUCs: 972 (down 55 from the 1,027 in February)
  • inactive well count: 2,161 (up 72 from 2,091 in January )
  • March: it makes sense that inactive wells are up; DUCs are down; when DUCs are completed, neighboring wells are shut in to protect them; 
  • total off line for operational reasons: 3,133
February, 2020:
  • DUCs: 1,054 (up 30 from the 1,024 in January)
  • inactive well count: 2,091 (down 516 from 2,607 in January )
  • if I recall correctly, December, 2019, was a fairly "mild" winter by North Dakota standards;
  • January: huge jump in DUCs and inactive wells; 
  • February, 2020, was a fairly mild month, as I recall;
January, 2020:
  • DUCs: 1,024 (up 66 from the 958 in December)
  • inactive well count: 2,608 (up 687 from 1,920 in December -- a huge increase)
  • totals, wells off line for operational reasons: 3,631 -- up significantly month-over-month -- an increase of 753 or up an astounding 26% from the previous month;
  • this sets a new record of the the number of wells off line for operational reasons; the previous record was September, 2019, (3,020)
December, 2019:
  • DUCs: 958 (up 39 from the 919 in November)
  • inactive well count: 1,920 (up 194 from 1,726 in November)
  • totals, wells off line for operational reasons: 2,878 -- up significantly month-over-month -- an increase of 233 or about 8.8% from the previous month;
  • the number of wells off line for operational reasons in September, 2019, (3,020) sets a new record 
November, 2019:
  • DUCs: 919 (up 34 from the 885 in October)
  • inactive well count: 1,726 (up 43 from 1,683 in October)
  • totals, wells off line for operational reasons: 2,645 -- about average for the Bakken -- but up 77 or about 3% from the previous month;
October, 2019:
  • DUCs: 885 (down 31 from the 916 in September)
  • inactive well count: 1,683 (down 421 from 2,104 in September)
  • totals, wells off line for operational reasons: 2,568 -- about average for the Bakken
September, 2019
  • awaiting completion (DUCs), 916 (the November Director's Cut said the number of DUCs in August, 2019, was 930 which is different than that initially reported a month ago (see below)
  • inactive well count; 2,104 ((the November Director's Cut said the inactive well count in August, 2019, was 1,675 which is different than that initially reported a month ago (see below)
  • total: 3,020
  • if this is accurate, the number of wells off line for operational reasons in September, 2019, (3,020) sets a new record
  • it looks like 2,665, wells off-line for operational reasons back in March, 2019, is now the 2nd highest number of wells off-line for operational reasons
August, 2019
  • awaiting completion (DUCs), down 14, to 916
  • inactive well count; down 62 to 1,613
  • total: 2,529  
  • it looks like 2,665, wells off-line for operational reasons is still the all-time high (March, 2019)
July, 2019 
  • awaiting completion (DUCs): down 53, to 930
  • inactive well count: up 122, to 1,675
  • total: 2,605 (up from 2,536 last month) or an increase of 2.7% this represents about 1,000 more wells than will be drilled this calendar year; 2,536 wells is about the number of wells North Dakota will complete every three years
  • it looks like 2,665, wells off-line for operational reasons is still the all-time high (March, 2019)
  • scroll down to original post to see 2018 data and note how historically high the current number of inactive well is -- stunning
June, 2019:
  • awaiting completion (DUCs): down by 2 to 983
  • estimated inactive well count: down 3, to 1,553
  • total: 2,536 (down from 2,541 last month) -- this represents about 1,000 more wells than will be drilled this calendar year; 2,536 wells is about the number of wells North Dakota will complete every three years
  • it looks like 2,665, wells off-line for operational reasons is still the all-time high (March, 2019)
May, 2019:
  • awaiting completion (DUCs): up by 23 to 985
  • estimated inactive well count: down 69, to 1,556
  • total: 2,541 (down from 2,587 last month) -- this represents about 1,000 more wells than will be drilled this calendar year; 2,561 is about the number of wells North Dakota will complete every three years
  • it looks like 2,665, wells off-line for operational reasons is still the all-time high (March, 2019)
April, 2019:
  • DUCs: 962 (down 6 from last report)
  • inactive: 1,625 (down 72 from last report)
  • total: 2,587 (down from 2665 last month; this represents about 1,000 more wells than will be drilled this calendar year; 2,561 is about the number of wells North Dakota will complete every three years)
  • WTI was about $2/bbl higher in April, 2019, compared to March, 2019
  • 2,665 last month was probably an all-time high
March, 2019:
  • DUCs: 968, up 74 from last report
  • inactive: 1,697, up 30 from last report
  • total: 2,665 (up from 2,561 last month; this represents about 1,000 more wells than will be drilled this calendar year; 2,561 is about what North Dakota will complete every three years)
  • I do believe that this (2,665) represents an all-time high)
February, 2019:
  • DUCs: 894, up 27 from last report
  • inactive: 1,667, up a whopping 150 from last report
  • total: 2,561 (up from 2,332 last month, about 800 more wells than will be drilled this calendar year)
January, 2019:
  • DUCs: 867, up 44 from last report
  • inactive: 1,517, up 8 from last report
  • total: 2,384 (up from 2,332 last month, about 800 more wells than will be drilled this calendar year)
December, 2018:  
  • 823, down 134 from last report -- huge decrease
  • inactive: 1,509, up 128 from last report -- wow, look at that jump in the number of inactive wells 
  • total: 2,332 (down slightly from 2,338 in the last report; but 2,332 wells is still way more than the total number of wells that will be drilled in North Dakota this year)
November, 2018:
  • 957, down 2 from previous report
  • inactive: 1,381, up 18 from previous report
  • total: 2,338
October, 2018:  
  • 959, up 31 from previous report
  • inactive: 1,363, up 23 from previous report
  • total: 2,322
May, 2018:  
  • 955, up 13 from previous report
  • inactive: 1,569, down 48
  • total: 2,524
April, 2018:
  • 942, up 26 from previous report
  • inactive: 1,521, down 13
  • total: 2,463
March, 2018:
  • 916, up 15
  • inactive: 1,653, down 1 
  • total: 2,569
February, 2018:
  •  901, up 48
  • inactive: 1,654, down 100
  • total: 2,555
January, 2018:  
  • 853, down 24
  • inactive: 1,554, up 85
  • total: 2,407
December, 2017:
  • 877, down 6
  • inactive: 1,469, down 23
  • total: 2,346
November, 2017:
  • 883, down 6
  • inactive: 1,492, up 21
  • total: 2,375
October, 2017:  
  • 889, down 36
  • inactive: 1,471, up 27
September, 2017:
  • 853, down 10
  • inactive: 1,444, down 54
August, 2017:  
  • 863, down 26
  • inactive: 1,498, up 20
July, 2017:  
  • 889, up 34
  • inactive: 1,478
June, 2017:  
  • 865, up 35
  • inactive: 1,458, down 53
  • total: 2,323
May, 2017:
  • 830, unchanged
  • inactive: 1,511, up 45
  • total: 2,341
April, 2017:  
  • 830, up 141
  • inactive, 1,466, up 167
  • total: 2,296
March, 2017:
  • 689, down 110
  • inactive: 1,299, down 312 (need to correct typo at that post)
  • total: 1,988
February, 2017:  
  • 799, down 3
  • inactive: 1,611, down 67
  • total: 2,410
January, 2017:  
  • 802, down 5
  • inactive: 1,678, up 105
  • total: 2,480
December, 2016:
  • 807, down 32
  • inactive: 1,573, up 54
  • total: 2,380
  • corrected: 9/9/19
November, 2016:  
  • 839, down 21
  • inactive: 1,519, up 16
  • total: 2,358
  • corrected: 9/9/19
October, 2016:  
  • 860, down one
  • inactive: 1,503, down 11
  • total: 2,363
  • corrected: 9/9/19
September, 2016:  
  • 861, down 27
  • inactive: 1,514, unchanged
  • total: 2,375
  • corrected: 9/9/19 
August, 2016:
  • 888, down 24
  • inactive: 1,514, up 42
  • total: 2,402
  • corrected: 9/9/19
July, 2016:  
  • 912, up 25
  • inactive: 1,472, down 14
  • total: 2,384
  • corrected: 9/9/19
June, 2016:  
  • 887, down 44
  • inactive: 1,486, down 98
  • total: 2,373
  • corrected: 9/9/19
May, 2016:
  • 931, up 39
  • inactive: 1,584, down 6
  • total: 2,515
  • corrected: 9/9/19

Original Post
See Director's Cut, May, 2018, data.

From the June 29, 2018, update, now updated through most recent data, adding data for May, 2018:

From most recent data, May, 2018 - May, 2017, most recent to oldest, which brings us up to date:
  • taken from my posts on the blog. In May, 2017, I started posting DUCs and inactive wells on a regular basis. It's too time consuming to go back and fill in the few months in which I did not post data so I'm not going to fill in that bit of missing data. I think the existing data tells the story
  • data below: month/year, DUCs, inactive wells. All data below, including the up/down change were taken directly from the NDIC Director's Cuts
  • range:
    • an outlier, March, 2017: 689
    • otherwise, a low of 799 in February, 2017
    • a high of 955 in the most recent month, May, 2018
  • not graphed, but the trend for the past four months has been up 
    • January, 2018: 853
    • up 48 in February, 2018, 901
    • up 15 in March, 2018, 916
    • up 26 in April, 2018, 942 
    • up 13 in May, 2018, 955
Inactive wells:
  • in data presented, we have never gone above 1,700 inactive wells
  • number of inactive wells in the past three months are among the highest numbers in the data presented
Disclaimer: in a long note like this and with so many numbers, and no triple-checking and no NYT fact-checker, there will be factual and typographical errors.

Tuesday, January 14, 2020

Shaleprofile Posts November, 2019, Bakken Data -- January 14, 2020

To make it easier to google, I'm bringing a reader's comment up to the main body of the blog. A reader sent this comment to an earlier post:
Shaleprofile is up with their ND info for November. They regularly get the info a little early and have matched the NDIC a few days later.

https://shaleprofile.com/blog/bakken-monthly-update/north-dakota-update-through-november-2019/

This month, they didn't give us the exact info on total production (about 1.5 MM bopd) versus hz only (gave exact number). Their focus is really the hz wells. In the past, they have sometimes given the exact overall info as well. But in any case, sounds like a very small drop, about 1,000 bopd. So essentially flat. Gas was up and broke 3.1 MM bopd.

Good article overall, but some small crit/comments:

1. He notes DUC depletion but I would be a bit wary of interpreting that:

(A) He uses Frac Focus, but doesn't model it like EIA does. This might be better than how ND does it. But it's prone to a lag error (like TX production). You can see this if you look at how the OCT19 number of DUCs changed from last month to this month. Grew from 725 to 744. In comparison, the OCT18 numbers had no change (767 and 767).

(b) There seems to be some seasonality of DUCs. Building in the winter when it is harder to do completions than to drill and then falling from ~May to ~NOV. So you can't really intuit a general trend when looking at such seasonality. In fact the OCT19 number (744, perhaps not yet final, may go up more) is not that different from the OCT18 number (767, looks final).

2. Says well quality unchanged since 2017. I think this is close to fair. Especially in contrast to the massive improvements prior to that (while the peak oilers were saying sweet spots were done many years ago!). That said, the "cum" view does show s small improvement from 17 to 18. And a tiny improvement from 18 to 19. You know the peak oilers would be talking about getting worse, if those changes had gone the other way!

3. There is a very interesting figure at the bottom of the article where he shows a view not normally published. Shows the DUCs by year spudded. I get the following inferences:

A. Most of the DUCs are normal inventory. Relatively few "dead DUCs". In contrast to the peaker complainers. That said there are probably some dead DUCs.

B. 2016 has almost no DUCS left. 2015 has guite a lot. Seems to show that 2016 was only sweet spot drilling (mix enrichment) and thus had no dead DUCs. 2015 in contrast has a higher percentage and absolute number of dead DUCs. This despite more time. So there may be some dead DUCs still in there.

C. Pretty small amount of 2014 and before DUCs.

D. Presumably looking at abandonmment (temp and permanent) would also be revealing, but I haven't structured this analysis and may lack the paid version to really investigate this.

4. As usual, there is sort of a straddling the line on EUR ("ultimate return") where he claims a log rate to cum plot gives insights on EUR, but doesn't commit to an interpretation. In the past, the peakers have gone to town a bit on this view, without detailing their assumptions.
Comments:

I track the DUCs and inactive wells at this post. Those are the data points provided by the NDIC.

I update status of DUCs going all the way back to 2010, check up on DUCs about once every month. I go to the various pages linked at that post and scroll through, looking for SI/NC (DUCs) and then update them. The reader is correct: the operators have done a great job completing those DUCs. There is a two-year deadline to get DUCs completed.

Wells reported in 4Q for three years:
  • 4Q18: three DUCs, one pad; one DUC that was never expected to produce;  
  • 4Q17: no DUCs
  • 4Q16: no DUCs
It should be noted that my data is based on wells coming off confidential list and reported by the NDIC in daily activity report. If there are wells that were not on the confidential list and not reported on the daily activity list, I would not have that data. 

Unless I'm missing something Shaleprofile provides a "snapshot" in time with what is going on in the Bakken. Possibly there is more of an analysis / narrative regarding the trends in the Bakken for those who have access to the full report.

If the numbers are correct, crude oil production drops 1,000 bopd and natural gas hits 3.1 bcf/d, we should see another all-time "boepd" record.

To put this November data in context, see EIA's dashboard. This will download as a pdf.

Tuesday, December 15, 2015

DUCs -- Rigzone Analysis -- December 15, 2015

This is an interesting analysis by the Rigzone staff with regard to DUCs. There are many story lines. This analysis focuses on how fast and how much oil can be brought to the market if the price of oil makes it economical to complete these DUCs.

It's an interesting analysis but I think it has very little to do with the Bakken. Read the analysis and decide for yourself.

But here are my thoughts. (As you read through this, remember that fracking naturally slows during the very, very cold months of winter, and then again during the spring thaw.)

1. They assume the DUCs will all be completed (why would a company drill a well if they did not plan to complete it) but with the caveat that if the price does not support completing these DUCs, some may not be completed. When I first started blogging, the completion (fracking) accounted for about half the total cost; drilling vertically and then drilling horizontally to "total depth" accounted for the other half. With drilling becoming much more efficient and fracking now involving many more stages, more sand, and more water, the costs of fracking have gone up in proportion to drilling. Rigzone puts the total cost at 1/4th for drilling and 3/4ths for fracking.

What they do not mention is that the upfront costs of a) building the road to the pads; b) building the pads; c) laying the pipeline -- water, wastewater, oil -- in some cases; d) paying the upfront lease money for the initial well; e) putting in the storage tanks; f) doing the survey studies from scratch; etc., has all been done. Those were significant costs; if anyone has seen the miles of roads the oil companies have built in the Bakken, they know this is a great expense to have behind them. Yes, I know there are maintenance costs and the roads are probably still being paid off, but ... whatever.

But the biggest factor affecting whether to complete or not complete a well is knowing that these wells will be productive. It's not like these are wildcats and they don't know whether they will have a well or not.

One might want to take a look at the price of oil in 2000 - 2004 when the Montana Bakken boom began. 

2. Rigzone suggests that in one scenario operators will leave the DUCs uncompleted until the price of oil makes them economical, and then at that time, there will be a "mad rush" (my words, not Rigzone's) to complete the DUCs.

NDIC has not given the operators an "infinite" amount of time to complete these wells. In North Dakota, operators have been given an additional year to complete wells, going from one year to two years. I update the status of wells periodically, and note that DUCs are being completed on an ongoing basis. When wells come off the confidential list, whether they have an IP or go to DRL status or become a DUC, I post them at the "news wells reporting" page. DUCs are indicated by SI/NC. When I go back and update the wells, if a well that was previously on the SI/NC list (a DUC), I put the IP in bold blue to show that it was a completed DUC. If it was completed when it came off the confidential list or if it went to DRL status before being completed, I left the IP in bold red.

In the last calendar quarter (3rd quarter 2015) one can see that BR is completing their DUCs in a timely manner. When one looks at 2nd quarter 2015, one can see how few DUCs really remain compared to all the wells that have been drilled. Again, IPs have been put in bold blue if they were previously on the DUC (SI/NC) list. Note how many wells previously on the DUC list as recently as the 2nd quarter 2015 have now been completed. BR and Oasis are completing their DUCs in a timely matter. It appears CLR completes about half their DUCs as quickly as BR and Oasis. Zavanna is not completing their DUCs as quickly; same with EOG for the most part. EOG also tends to put their wells on the TATD list. 

How TATD differs from SI/NC I do not know.

3. Rigzone suggests no one really knows how many DUCs there are. That may be true in states where reporting is not required as frequently as in North Dakota. North Dakota's reporting guidelines probably allow for the most transparency of any state in the union. I think Lynn Helms and the NDIC know within 10% how many wells are on DUC status. We've talked about the reporting regulations many times before.

4. I can't speak to the extent this is true in the Permian or the Eagle Ford, but Bakken DUCs are being placed in the very spots in the basin. The boom went on long enough that the operators know precisely where the best middle Bakken wells are. They did not quite map out the upper Three Forks to the same extent. And the lower benches of the Three Forks have not been mapped out at all, at least in the big scheme of things, or compared to the middle Bakken. These DUCs are all expected to be big wells.

5. The other thing about these DUCs is that they are being placed where there are already any number of wells already producing. It appears there is a halo effect with fracking, and operators may be enjoying some increased production from existing, neighboring wells with a DUC is completed/fracked.

Tuesday, January 26, 2016

Are DUCs A "Big Deal"? The Poll Is Closed -- January 26, 2016

Now that we have an additional month of data from the NDIC, and now that CLR, one of the bigger operators in the Bakken, has provided guidance on its own DUCs, I'm going to close out the poll at the sidebar in which we asked whether DUCs in the Bakken were a "big deal" or not:
  • Yes: 63%
  • No: 33%
  • The four comments did not provide any insight, unfortunately; it does appear that those providing the comments have not been paying attention; were one card short of a full deck; had trouble understanding the poll; and/or have very limited insight into the importance of the Bakken, as defined by the Million Dollar Way. Be that as it may, there was little evidence any of those commenting had ever read the purpose of the blog. It's possible there was some issue with literacy. But I digress. LOL.
I have gone back and forth on this issue -- whether DUCs are a "big deal" for quite some time. When I initially posted the poll, I did not think DUCs were that big a deal. When I posted the poll, operators seemed to be completing these DUCs fairly quickly, not really delaying completion for the full two years as allowed under the new rules.

However, recently it appears that DUCs are not being completed as quickly as possible. Of course, some of this may be due to the weather (winter). The number of DUCs has plateaued over the last couple of months (about 1,000) according to NDIC's monthly report.

The most recent guidance suggested by CLR's press release on the company's plans for 2016 suggest that DUCs are going to be a huge deal going forward. From the press release:
Continental plans to defer completing most Bakken wells in 2016, which will increase the drilled but uncompleted ("DUC") inventory from 135 gross DUCs at year-end 2015 to 195 gross DUCs at year-end 2016. This is a high-graded inventory of DUCs, with an average estimated ultimate recovery (EUR) per well of 850,000 Boe.
The question is whether operators will ask for waivers to extend the two-year window on a case-by-case basis. By 2017 there could certainly be a huge backlog of DUCs. 

Based on that one paragraph taken from the CLR press release, it is my hunch that at worse, Harold Hamm will do "quite well" in 2017, and, in fact, could hit a huge payday by 2018 if things pan out the way the tea leaves suggest they will.

By the way, let's say CLR's DUC guidance is representative across the Williston Basin. There are currently about 1,000 DUCs in the Bakken. CLR currently has about 135 DUCS which will increase to 195 by the end of the year [(195 - 135)/135 = a 45% increase year-over year. That would/could suggest about 1,500 DUCs across the Bakken at the end of 2016.

Tuesday, February 14, 2017

More On The RBN Energy Post Earlier Today -- February 14, 2017

Poll: in the January, 2017, NDIC Director's Cut, the number of DUCs in North Dakota was estimated to be 839. Will there be fewer or a greater number of DUCs reported in the February, 2017 (data for December, 2016), Director's Cut?

RBN Energy: What's with all the DUCs?
The latest Drilling Productivity Report from the EIA, released yesterday (February 13, 2017), shows that while the combined rig count in the seven major U.S. shale plays rose about 25% in the fourth quarter of 2016 versus the previous quarter, and the number of wells drilled was up 29%, well completions were up a paltry 1%, leading to an increase in the inventory of drilled-but-uncompleted wells (DUCs).
Completions accelerated a bit in January 2017, but DUCs still continued to rise. That certainly seems counterintuitive.  With crude oil prices stable in the low $50’s over the past few months you might think that producers would be pulling DUCs out of inventory, and in fact there have been statements to that effect in several producer investor calls. This is not just an exercise in energy fundamentals numerology. If the DUC inventory is increasing, then production will not be ramping up as fast as the growing rig count would imply.
But what if, as some early signs indicate, the historical relationships are out of whack and the DUC inventory isn’t growing but rather declining? In that case, forecast models could be understating the outlook for production growth, and the market could be in for a more rapid and steeper rebound in oil and gas production than many expect. In today’s blog, we delve into the DUC inventory data and its potential upside risk to production forecasts.
So, what's the status of DUCs now?
Understanding the DUC inventory trend is critical to forecasting production because it reflects the ability of producers to respond in relatively short order to market fundamentals such as price and demand without a single rig addition.
At any given time, there is always a substantial base inventory of DUCs in the market due to the normal delay between drilling and completion activities.
But increases or decreases in the DUC inventory can speed or slow the rate of production growth (or decline) in the short- or mid-term.  When crude oil prices crashed in 2014 through early 2016, we saw an increase in DUCs as producers continued to drill, but deferred completing wells due to economics, contractual commitments and other factors.  It was generally expected that as prices increased, many producers would start competing those previously drilled wells (i.e., taking DUCs out of inventory) to start generating cash from their drilling investment. 
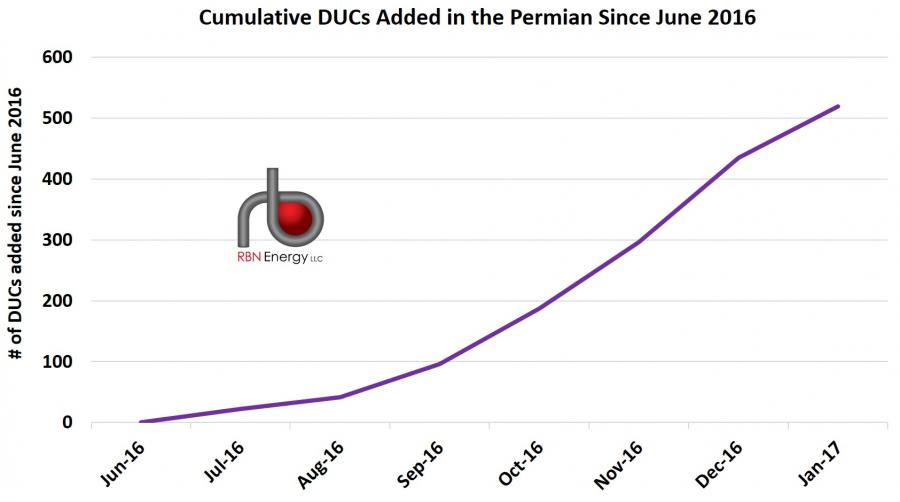
But as shown in Figure 1, (according to EIA’s DUC inventory and Drilling Productivity Report data) that was not the case, particularly in the most prolific of plays – the Permian.
Since June 2016, more than 500 DUCs have been added to inventory, far out of proportion to the increase in the total Permian rig count
Figure 1; Source: EIA Drilling Productivity Report

Other data points:
  • the growth in DUCs is accounted for almost entirely in the Permian
  • of the 92 DUCs added last month, 84 were in the Permian
Challenge:
RBN Energy notes that official data is about two months old; the EIA has to "model" data based on historical relationships between rig counts to drilled and completed wells -- but those relationships are constantly in flux, says RBN Energy, "and even more so in the past few months as prices jumped and producer activity rapidly accelerated."
RBN noted an interesting phenomenon in late 2016: an increase in delineation wells away from the "sweet spots." This obviously was happening more in the Permian, and not so muchin the Bakken.

RBN suggests that:
  • while the EIA is projecting an increase in the number of DUCs,
  • in fact, perhaps producers are working off their inventory of DUCs
Pad drilling: and then something that regular readers will recognize -- the same thing is happening now in the Permian that was happening in the Bakken -- pad drilling necessarily results in an increased number of DUCs simply because operators will drill eight wells on a pad before fracking any of them.

Bottom line: US shale production is likely to see a significant jump in late 2017.

Perhaps OPEC realizes that also: the "cartel" has suggested that production cuts will have to be extended into 2H17. 

Friday, June 7, 2019

Weekly Number Of Active Oil Rigs Meaningless -- June 7, 2019

Locator: 10010RIGS.

I've maintained for quite some time, probably since 2014 or thereabouts, that rig counts no longer matter (not to be taken out of context).

I was reminded of that when I saw this headline over at oilprice.


For the record:
  • oil rigs fell by 11 (to 789; or a decrease of 1.375% -- big whoop!)
  • natural gas rigs actually increased by 2 (to 186, or an increase of 1% -- another big whoop!)
  • overall, a net decrease of 9 rigs (or a decrease of 0.9% -- not even a 1% decrease and that's the big headline -- wow -- completely missing the point)
Much more relevant: number of wells offline for operational reasons and wells drilled to depth but not completed (DUCs). I track that in the Bakken at this site. These are wells that could be brought on line within days in some cases, weeks in all cases, if necessary.

By my reckoning there are upwards of three-years worth of inactive wells/DUCs in the Bakken. Stop drilling in the Bakken today, and the state could clip along for three years just be bringing those wells into production.

And that doesn't even count the tens of thousands, perhaps twenty thousand wells that should be re-fracked in the Bakken with modern completion strategics and state-of-the-art technology.

I don't track the numbers in the Permian but my hunch is that at some point in the future, the similar data point in the Permian will be upwards of 10 times what it is in the Bakken.

I track the number of DUCs and inactive wells in North Dakota at this site.

One can also track posts on DUCs using this "search."

Related tags:
Much more relevant than rig counts:
  • number of DUCs
  • fracking backlog
  • drilling rig efficiency
  • the EPA drilling reports (the "dashboards")
By the way, the "raw" number of rigs -- worldwide -- added or taken down is incredibly useless information. If one wants to consider the number of rigs as somewhat meaningful, we need to know:
  • regionally, the rig numbers, not the global numbers; and, 
  • rigs being added or taken down on a percentage basis
Even when the number of active rigs in North Dakota was hitting "modern" lows, North Dakota was still setting all-time production records.

Some oft-visited posts:

Sunday, January 20, 2019

DUCs -- It's Complicated -- January 20, 2019

Nick Cunningham over at oilprice suggests that DUCs will make crude oil production hard to forecast going forward. One could argue that's been a problem for quite some time.

I doubt we will ever be able to find out who coined the "DUC" acronym but without a doubt Lynn Helm was the first to use it on a regular basis when talking about the Bakken. DrillingInfo takes the acronym back to 2014, at least in the archives at the link.

I have a tag for "DUCs" but I don't use the tag much any more, most recently November 24, 2018.

Anyway, back to Nick Cunningham and DUCs. Here's the link
The number of drilled but uncompleted wells (DUCs) in the U.S. shale patch has skyrocketed by roughly 60 percent over the past two years. That leaves a rather large backlog that could add a wave of new supply, even if the pace of drilling begins to slow.
The backlog of DUCs has continued to swell, essentially uninterrupted, for more than two years. The total number of DUCs hit 8,723 in November 2018, up 287 from a month earlier. That figure is also up sharply from the 5,271 from the same month in 2016, a 60 percent increase. The EIA will release new monthly DUC data on January 22, which will detail figures for December.
Some level of DUCs is normal, but the ballooning number of uncompleted wells has repeatedly fueled speculation that a sudden rush of new supply might come if companies shift those wells into production. The latest crash in oil prices once again raises this prospect.
The calculus on completing wells can cut two ways. On the one hand, lower oil prices – despite the recent rebound, prices are still down sharply from a few months ago – can cause some E&Ps to want to hold off on drilling new wells. That may lead them to decide to complete wells they already drilled as a way of keeping production aloft while husbanding scarce resources. Companies that are posting losses may be desperate for revenues, so they may accelerate the rate of completions from their DUC backlog.
North Dakota allows two years from spud to completion; it used to be a year. I don't know what the rules are in other states. But North Dakota will permit DUCs to exceed two years but require a waiver. Those are rare.
But completing DUCs is low-hanging fruit. The cost of drilling a well accounts for 30 to 40 percent of the total cost.
As a result, companies deciding on whether to bring a DUC online has already incurred the drilling costs. A shale company may decide to scale back on new drilling this year because of low prices, but the rush of fresh supply from DUCs may allow output to continue to grow. Of course, any decline in new drilling will eventually be felt in the production data, but that may not show up until somewhere down the line. More completions from the DUC backlog could keep near-term production figures on the rise.
How this shakes out is anybody’s guess, but at a minimum, the explosion in DUCs over the past two years complicates oil production forecasts for this year.
By the way, that data point that the cost of drilling a well accounts for 30 to 40 percent of the total cost is an interesting data point. I had thought the same thing. During the early days of the Bakken boom, drilling/completion were closer to 50/50 but drilling is now incredibly less expensive.

Friday, February 19, 2016

Not Ready For Prime Time -- Thoughts On DUCS -- NY Times And Comments -- December 27, 2015

Note: this has been sitting in draft for two months now.  I didn't know what to do with it. It rambles. It is very poorly written. It is not ready for prime time. It was a response to a reader some months ago who sent me a New York Times article. But I'm tired of sitting on it, so I will post it to simply get "rid of it." 

This was my unedited reply to a reader regarding an article in the New York Times on the subject of DUCs. Prior to posting, the reply will be edited for punctuation, grammar, etc., but I plan to keep the basic observations unchanged:
Another great article in the Times. Years ago, once I realized that the front page of the Times was their op-ed page, it was much more enjoyable to read the newspaper. They really do write well, and if weren't so dang expensive (something like $7.00 now) I would subscribe to the Sunday edition.

The Sunday Times was required by our 10th grade social studies teacher for which I am eternally grateful.

Nice, nice article on DUCs. Many, many story lines.

1. This article suggests DUCs can be brought on line quickly; others say not. I'm in the camp that DUCs can be brought on very, very quickly. Anyone who says otherwise, in my mind, has not been paying attention and/or following the Bakken very closely. In this case the Times got it right.

2. The writer says this but I don't think he/she offers his/her own conclusion:
Some analysts say oil companies like Anadarko, EOG Resources and Continental Resources may collectively risk suffocating the very price revival they anticipate by releasing abundant new supplies once prices inch up. Others say the eventual impact would be small and short-lived, but since the industry has never used this strategy before, no one can be sure. 
There are two issues here.

The first issue has to do with profit, price, etc. The price one sells oil for does not matter: the only two things that ever matter is survivability and profitability, and profitability is based on margins, not the price of oil. Right now, the only issue is survivability.

The second issue has to do with volatility of the price of oil and the geopolitics of oil (using oil as a weapon which the Mideast has historically done): the US is now the swing producer for light oil and as such, especially with all those DUCs, and all those fields not now being exploited.

Barring a major geopolitical event anywhere -- but particularly in the Mideast -- and especially now with the ban on US crude oil exports repealed -- it's hard not to see the global oil market as a much more efficient market, responding much better to real supply and demand, rather than responding to rhetoric from self-serving dictators and oligarchies, which was often the norm in the past. Saudi simply had to say it was going to increase / decrease production and commodity markets reacted even before anything "concrete" had happened.

3. I think the Times writer focused on the profitability and survivability of US oil companies (the article is in the "energy and environment section"; it seems as if the article should have been in the business / finance section). In the "energy and environment section" the article should have been focused on a bigger picture -- what DUCs mean for the global energy environment. I have little interest in individual companies in the oil and gas industry (with regard to the blog) except as a means of following the industry to see how this will all play out.

4. I'm surprised we haven't seen more articles on what inexpensive energy means to growing economies and to the US. All this natural gas and all this oil at really inexpensive prices is coming from a reliable source, and from a country with a democratic model of government. This should be an incredibly good news story and yet this seems to be another article on whether individual companies will survive, or how they will survive, and their profitability.

5. I plan to write a post on whether "DUCS" in the Bakken are that big a deal. I was going to post the question / essay this weekend, but I need at least one more month of data from the Director's Cut -- to see the status of Bakken DUCs after another month. As you know, NDIC gave operators an additional year to complete their wells. And yet, after reviewing the SI/NC (DUCS) for the past year, I don't think DUCs mean a thing in reality. Allowing an extra year was incredibly important to the oil companies in North Dakota "just in case," but in fact it appears that companies are not delaying completion all that long. In the good ol' days, they drilled a well and completed it as quickly as logistically possible and NDIC / operators crowed optimistically how fast they could get oil to the market from the initial spud -- often measured in weeks. It looks like the little I know about it, the DUCs are adding a few months; big deal. Not.

6. The DUCs also solved another problem: the perception that the US was running out of storage space. That turned out not to be true, and even if it was, it is now resolved with the repeal of the ban on US crude oil exports. There is a huge amount of storage capacity globally and if Cushing starts to fill up again, there are many places to store it overseas. Vitol with its new storage facilities in South Africa is that story. In the old days, oil arriving at the Gulf Coast, was transported north by pipeline to Cushing. Now, new pipelines and flow reversal of existing pipelines mean that Cushing oil is now going to the Gulf Coast.

7. This is a great story for New Yorkers who had not yet heard of DUCs, unlike those who have been following the US shale story closely. But as the writer said, "... since the industry has never used this strategy before, no one can be sure" -- or another way of putting it: we are in uncharted water.

8. I think it's a fascinating story. At the end of the day, it's not about the price of oil, it's about the margin. This is a great time to be a privately-held company in the oil and gas industry if one has the deep pockets and/or financial backing of bankers/private investors (hedge funds) to keep going for the next year or two. Publicly-traded companies are looking at each quarter and that has to be very, very challenging.

Friday, June 29, 2018

Update Regarding North Dakota DUCs -- June 29, 2018

Disclaimer: in a long note like this and with so many numbers, and no triple-checking and no NYT fact-checker, there will be factual and typographical errors.

Updates

July 2, 2018: with regard to DUCs, my thesis is that shale operators are using DUCs to manage their assets. Someone suggested the reason there are so many DUCs is because of limited takeaway capacity. I was thinking the same thing. Then I read this from last week (the article is a keeper; it's been archived).
“The indicator that I typically watch, the Brent Oil price minus the WTI price, that spread was just over $10,” Kringstad said. “When that price is higher than $5 per barrel, historically the industry tends to pull barrels off the pipeline systems and put them on the rail network to take advantage of that market situation.”
CBR: scalable.
Number to remember: any number higher than $5, Brent/WTI spread. If Brent is $10 higher than WTI, then it makes sense to send Bakken oil to east coast where they buy Brent, instead of to Cushing where they buy WTI.

And more from the article:
Rail transport hit a low last summer of around 120,000 barrels per day, Kringstad said, but was back up to 260,000 barrels per day in March as market conditions shifted to favor east and west coast crude by rail markets. 
Some of that shift is a result of oversupply in Cushing, Oklahoma, Kringstad said. Permian oil is congesting that market hub, lowering prices. Oil that can go to east and west coast refineries is thus finding better prices there.
Pipeline capacity, though pushing the upper limits, is still adequate (barely?):
Long-term forecasts for North Dakota oil production by the mid-2030s is for between 2 and 2.4 million barrels of oil per day, about double of what it is now, Kringstad said.
“When we look at the takeaway capacity options, it’s right around 1.4 million bpd with what is now in service or slated to come online in the next several years, so there is potentially a 600,000 to one million barrel per day potential shortfall long term,” he said.
Original Post

Update regarding DUCs.

Bottom lines:
  • Bakken wells are most productive after initial frack (and possibly after subsequent fracks); completing one or two more DUCs in any given month can literally mean the difference between setting a new month-over-month production record and not setting a record
  • there was a temporary increase in the number of DUCs during the Saudi Surge (2015 - 2016)
  • considering the price of oil over the past three months, I consider the number of DUCs (now over 900) to be more than expected
    • I know there are folks who disagree with me
    • there are articles in the mainstream press suggesting ND is simply working down the backlog that occurred during the Saudi Surge; this may be the best article (a Bloomberg article) suggesting ND is "working down that backlog"
    • the second and third graphs below do not support that argument (although that's in the eyes of the beholder)
    • if ND was "working down the backlog" it does not explain the upward trend for the past three months
  • anecdotally, recently there has been a long stretch in which none to few DUCs have been reported as completed 
  • most analysts I have come across, who are much, much more knowledgeable than I am, do not consider DUCs to be an issue worth spending much time on
Bottom, bottom line: with regard to DUCs, there's something going on that isn't explained in the data. Time will tell. As it always does.

Note: the number of DUCs (drilled to depth but waiting for completion) and inactive well numbers (AB and IA) are all estimates, although the number of DUCs should be a fairly accurate number. In addition, it depends on the exact day that the data is collected.

I will post graphics first to bring us up to 2016 or so. These graphics were taken from various sources using a google search.

First, these three graphics.

From January, 2014 -August, 2015:
  • range: slightly below 600 to a high of just under a 1,000; trend was moving up through all of 2015; this was during the Saudi Surge; the trillion-dollar mistake Saudi made trying to break the US shale operators


From January, 2014 - October 16, an overlap with above data, but takes us to October, 2016:
  • it makes no sense to me why EIA numbers are lower than NDIC numbers, when the former includes Montana and North Dakota, whereas the latter includes just North Dakota
  • range: slightly below 600 on a couple of occasions in 2014, before the Saudi Surge; to a high of almost 1,100; trend was moving up through all of 2015; this was during the Saudi Surge; the trillion-dollar mistake Saudi made trying to break the US shale operators; after September, 2015, there was a slight but definite downward trend, to about 900 in August, 2016

From December, 2016 - April, 2017, an overlap with above data, but takes us to April, 2017:
  • December, 2016: 790
  • April, 2017: 821


From most recent data, May, 2018 - May, 2017, most recent to oldest, which brings us up to date:
  • taken from my posts on the blog. In May, 2017, I started posting DUCs and inactive wells on a regular basis. It's too time consuming to go back and fill in the few months in which I did not post data so I'm not going to fill in that bit of missing data. I think the existing data tells the story
  • data below: month/year, DUCs, inactive wells. All data below, including the up/down change were taken directly from the NDIC Director's Cuts
  • range:
    • an outlier, March, 2017: 689
    • otherwise, a low of 799 in February, 2017
    • a high of 955 in the most recent month, May, 2018
  • not graphed, but the trend for the past four months has been up 
    • up 48 in February, 2018, 901
    • up 15 in March, 2018, 916
    • up 26 in April, 2018, 942 
    • up 13 in May, 2018, 955
Inactive wells:
  • in data presented, we have never gone above 1,700 inactive wells
  • number of inactive wells in the past three months are among the highest numbers in the data presented
The raw data:

September, 2018: 928, up 3 from previous report
inactive: 1,340, down 87

August, 2018: 925, down 18 from previous report
inactive: 1,427, down 59

July, 2018: 943, down 50 from previous report
inactive: 1,486, up 28

June, 2018: 993, up 38 from previous report
inactive: 1,458, down 111

May, 2018: 955, up 13 from previous report
inactive: 1,569, down 48

April, 2018: 942, up 26 from previous report
inactive: 1,521, down 132

March, 2018: 916, up 15
inactive: 1,653, down 1

February, 2018: 901, up 48
inactive: 1,654, down 100

January, 2018: 853, down 24
inactive: 1,554, up 85

December, 2017: 877, down 6
inactive: 1,469, down 23

November, 2017:

October, 2017:

September, 2017: 853, down 10
inactive: 1,444, down 54

August, 2017: 863, down 26
inactive: 1,498, up 20

July, 2017: 889, up 34
inactive: 1,478

June, 2017: 865, up 35
inactive: 1,458, down 53

May, 2017: 830, unchanged
inactive: 1,511, up 45

April, 2017: 830, up 141
inactive, 1,466, up 167

March, 2017: 689, down 110
inactive: 1,299, down 312 (need to correct typo at that post)

February, 2017: 799, down 3
inactive: 1,611, down 67

January, 2017: 802, down 5
inactive: 1,678, up 105

December, 2017: 807, down 32

November, 2017: 839, down 21
inactive: 1,519, up 16

October, 2017: 860, unchanged
inactive: 1,500 (unchanged (AB and IA)

September, 2017:

August, 2017: 888, down 24
inactive: 1,514, up 44

July, 2017: 912, up 25
inactive: 1,486, down 98

June, 2017: 887
inactive: 1,584

May, 2017: 931, up 39
inactive: 1,584, down 6

Disclaimer: in a long note like this and with so many numbers, and no triple-checking and no NYT fact-checker, there will be factual and typographical errors.

Friday, June 12, 2020

Director's Cut -- April, 2020, Data

Updates

June 13, 2020: a reader provided this assessment of the decline in US crude oil production:
No surprise with the decline in production of oil in USA.
-Shale wells decline rate of 6-8% per month.
-Rig count down for horizontal rig count down by 70+ percent
-Horizontal wells deplete ~70% on first year on average.
-Some wells shut in due to low spot price. Generally transport costs are fixed by pipeline increasing breakeven price to oil producer.
-Bankers will not be willing to loan $$$ to oil production companies unless you see solid $50+ oil prices.
-Shale oil production is more than 50% of oil production in USA.
-Large and small oil are cutting spending for shale, but keeping the long term projects going. One can drill and complete a shale well in months, not years.

Oil in storage is no surprise.
-Looking at EIA data, most of oil in storage increase is on Gulf Coast PADD 3. Other areas are even to down. https://www.eia.gov/petroleum/weekly/crude.php#menu
-IMHO the contango purchased oil is being delivered to California and Gulf coast.
-Tanker rates have decreased for both spot and long term charters indicating that the contango oil is being delivered.

IMHO price of crude should be in the $50s in a few months due to contango deliveries and continued reduction of oil production due to drilling downturn. Before shale oil a legacy oil will drilled vertically would typically decline 10-15% per year, unlike 70% for a shale well.

Original Post
Disclaimer: usual disclaimer applies. As usual, this is done very, very quickly. It is not proofread. There will be factual and typographical errors on this page. If this is important to you, go to the source. It is generally updated in segments, so until the entire report is completed, there may be old data still present. 
Link here.

Month-over-month crude oil production decreased by 14.8% ... Saudi Surge / destruction demand due to Wuhan flu.

Comments:
  • second month that "global economy" really started to tank due to Wuhan flu;
  • completions: huge drop in the number of completions -- down to 58 completions (preliminary) compared to 120 the month before; but similar to a month before that, 57 in February, 2020;
    • as a reminder, completions dropped from 70 wells in January, to a meager 57 wells in February (average 2.258 wells/day vs 1.966 wells/day); the greatest amount of oil produced by a Bakken well is in its first full six months after being fracked; a decrease in the number of completed wells is historically problematic;
  • DUCs decreased by almost 3%; the greatest amount of oil produced by a Bakken well is in its first full six months after being fracked; a large number of DUCs were completed but that could not offset the number of new completions, 58, vs 120 in the previous month, March, 2020;
  • so, DUCs decreased from 972 to 944 month-over-month but number of new wells completed plummeted from 120 (March, 2020) to 58 (April, 2020);
Disclaimer: As usual, this is done very, very quickly. It is not proofread. There will be content and typographical errors on this page. I need to check the figures later. If this is important to you, go to the source.
The Director's Cut
Data For April, 2020
North Dakota Oil and Natural Gas Production

Disclaimer: usual disclaimer applies. As usual, this is done very, very quickly. It is not proofread. There will be factual and typographical errors on this page. If this is important to you, go to the source.

Link here to past reports.

DUCs and wells off-line for operational reasons are tracked here.

A huge, huge "thank you" to Lynn Helms and his staff at the NDIC getting this information out in a timely and transparent manner. I am not aware of any other state that does such a good job providing such data.
 
Crude oil production:
  • April, 2020, preliminary: 1,219,086 ( (96% from the Bakken/Three Forks; 4% from legacy pools)
  • previous months:
    • March, 2020, final: 1,430,107 bopd
    • February, 2020, final: 1,451,681 bopd
    • January, 2020, final: 1,430,511 bopd (all-time time was November, 2019)
    • December, 2019, final: 1,476,777 bopd
    • November, 2019, final:1,519,037 bopd -- new all-time high after final figures come in;
      • revenue forecast: 1.4 million bopd
    • October, 2019, final: 1,517,936 bopd -- previous all-time high
    • September, 2019, final, 1,443,980 bopd -- very, very wet September that impacted oil fields
    • August, 2019, final, 1,480,475 bopd (previous all-time high)
    • July, 2019, final: 1,445,934 bopd (previous all-time high)
    • June, 2019, final: 1,425,230 bopd (previous all-time high)
  • month-over-month, bbls: decreased by 2,110,021  (April, 2020 -- March, 2020)
  • month-over-month, percent: -14.8%  (April, 2020 - March, 2020)
Gas production:
  • April, 2020, preliminary: 2,712,168 MCF/day
  • March, 2020, final: 3,128,393 MCF/day; 87% capture;
  • February, 2020, final: 3,109,750 MCF/day; 87% capture;
  • Previous months: 
    • January, 2020, final: 3,019,938 MCF/day; 84% capture rate (improved, month-over-month)
    • December, 2019, final: 3,061,412 MCF/day; 84% capture rate (improved, month-over-month)
    • November, 2019, final: 3,165,585MCF/day; new all-time high on a per-day basis; all time on a monthly basis, October, 2019)
      • 83% capture
    • October, 2019, final: 3,070,616 MCF/day
      • 81% capture
    • September, 2019, final: 2,946,391 MCF/day (note -- fell below the 3-billion threshold previously reported)
    • August , 2019, final: 3,014,419 MCF/day -- an all-time high
    • July, 2019, final: 2,944,816 MCF/day
    • June, 2019, final: 2,885,293 MCF/day
BOE, March, 2020, preliminary:
  • April, 2020, preliminary:
    • natural gas: 2,712,168 MCF/day = 451,953 boe
    • crude oil: 1,219,086 bopd
    • total boe, preliminary for March, 2020: 1,671,039 boepd
  • all-time high, November, 2019: 2,046,547 boepd
Producing wells:
  • April, 2020, preliminary: 15,465
  • March, 2020, final: 16,280 -- this sets a new all-time high for producing wells
    • previous high for previous wells: October, 2019: 16,169
  • February, 2020, final: 16,149
  • January, 2020, final; 16,014
  • December, 2019, final; 16,042
  • November, 2019, final: 16,110
  • October, 2019, final: 16,169 (new all-time high)
  • September, 2019, final: 16,115
  • August, 2019, final: 15,964 (all-time high was 15,954, July 2019)
  • July, 2019, final: 15,954 (another new all-time high)
  • June, 2019, 15,752
Wells off-line:
  • May, 2020: when I went through the May, 2020, data (as it was released in early July), it was very, very obvious that ND Bakken operators shut in their wells in May, not April).
  • April, 2020, preliminary
    • inactive: 2,168
    • DUCs: 944
    • total: 3,112 (for all that talk about all the wells coming off line, that does not appear to be true in the Bakken; operators simply drilled fewer wells)
  • March, 2020, final:
    • inactive: 2,161 
    • DUCs: 972
    • total: 3,133
    • March: it makes sense that inactive wells are up; DUCs are down; when DUCs are completed, neighboring wells are shut in to protect them; 
  • February, 2020, final: 
    • inactive: 2,091
    • DUCs: 1,027
    • total: 3,118
  • January, 2020, final:
    • inactive: 2,607
    • DUCs: 1,024
    • total: 3,631
  • December, 2019, final:
    • inactive: 1,920
    • DUCs: 958
    • total: 2,878
  • November, 2019, final:
    • inactive: 1,726
    • DUCs: 919
    • total: 2,645
Permitting:
  • May, 2020: 59
  • April, 2020: 62 (considering all that is going on, not bad)
  • March, 2020: 68
  • February, 2020: 60
  • January, 2020: 61
  • December, 2019: 67
  • November, 2019: 79
  • October, 2019: 126
  • September, 2019: 92
  • August, 2019: 127
  • July, 2019: 141
  • June, 2019: 127
Rig count:
  • Today: 10 (all-time high was 218 on 5/29/12)
  • April, 2020: 35
  • March, 2020: 52 
  • February, 2020: 54
  • January, 2020: 55
  • December, 2019: 55
  • November: 55
  • October: 56
  • September: 61
  • August: 62
  • July: 57
  • June: 63
Fort Berthold Reservation data partitioned out.

Completions:
  • April, 2020, preliminary: a whopping decreases from previous month; down to 58;
  • March, 2020, final: a whopping 120 wells were completed in March, 2020
  • February, 2020, final: 57
  • January, 2020, final: 70 (revised)
  • December, 2019, final: 88 (revised)
    • revenue forecast: 90
  • November, 2019, final: 92
  • October, 2019, final: 102
  • September, 2019, final: 117 (revised up from 94) (revised a second time, up from 112)
  • August, 2019, final: 102
  • July, 2019, final: 137
  • June, 2019, 102 (revised, last month's report); revised again, now, 123
  • May, 2019, 113 (final)
 Gas capture:
  • statewide, captured: 88% (flat)
  • statewide, captured:
    • April, 2020: 2,398,014 MCF/day -- captured -- still ahead of May, 2019, which was an all-time high at that time; down 17% month-over-month;
    • March, 2020: 2,711,084 MCF/day  -- final -- new all-time high
    • February, 2020: 2,699,065 MCF/day (final) new all-time high
    • January, 2020: 2,553,067 MCF/day (final)
    • December, 2019: 2,557446 MCF/day (final)
    • November, 2019: 2,594,922 MCF/day (new all-time high)
    • October, 2019:  2,524,405 MCF/day
    • September, 2019: 2,429,487 MCF/day
    • previous all time high was May, 2019: 2,287,761 MCF/day
    • FBIR Bakken:
      • April, 2020: 85%
      • March, 2020: 83%
      • January, 2020: 83%
      • December, 2019: 81%
      • November, 2019: 81%
        October, 2019, captured: 70% (was 79% in September)(75% reported two months ago, August, 2019)
Off line, to end of March, 2020: 3,136 -- back in January, 2020, it was -- 3,631; 
  • DUCs: 944 (down 28 from the 972 in March)
  • inactive well count: 2,168 (up 7 from 2,161 in March)
  • wells off line for operational reasons are tracked here;  
  • if I recall correctly, December, 2019, was a fairly "mild" winter by North Dakota standards;
  • January: huge jump in DUCs and inactive wells; 
  • February, 2020, was a fairly mild month, as I recall; 
  • March, 2020: DUCs down a bit, but inactive wells out-numbered DUCs 
  • April, 2020: Saudi Surge; demand destruction; WTI plummeted in price;
A year earlier, April, 2019, the "off-line well" data:
April, 2019:
  • DUCs: 962, down 6 from last report
  • inactive: 1,625, down 72 from last report
  • total: 2,587 (down from 2,664 last month; this represents about 1,000 more wells than will be drilled this calendar year; 2,561 is about what North Dakota will complete every three years)
Rig count:
  • Today: 10
  • May: 17
  • April: 35
  • March: 52
  • February: 54

Tuesday, October 15, 2019

One Last Push Before Winter? Rigs Up To 60 In North Dakota -- October 15, 2019

Locator: 10010HAROLDHAUGEN.

Dithering: LOL. Brexit will be delayed at least another year.

*****************************************
Slow News Day

DUCs: over at twitter --


You know it's a slow news day when analysts are debating this issue. 

I am not privy to the debate to which the good doctor refers. Having said that, the EIA reports that DUCs in US shale regions fell by 206 month-over-month to 7,740, according to a tweet. It would be nice to know the trend; a snapshot in time has no value whatsoever. At least not to me.

My two cents worth: it is virtually impossible to know exactly how many DUCs there are at any one time. Under the best of circumstances, it appears it takes about two weeks for what happens in the field to be reported to the public. With regard to quality of the DUCs, I don't have statistical data, but anecdotally, IPs for DUCs seem to be better than IPs of wells that are completed soon after they reach total depth. Certainly, DUCs are no "worse" than wells that are completed immediately.

I haven't found it yet, but I assume there's a discussion somewhere over at twitter asking how many angels can dance on the head of a pin.

For the record: I track the number of DUCs in the Bakken at this post.

It would be interesting to know who/when/where the acronym DUCs was coined. I think we had this discussion before. My hunch is that DUCs was an acronym coined by the NDIC. Just saying.

************************************

Delayed: due to federal holiday Monday, it appears reporting of some weekly data will be delayed a day.
 ******************************
Back to the Bakken 

Active rigs:


$52.8110/15/201910/15/201810/15/201710/15/201610/15/2015
Active Rigs6068593166

Three new permits, #37090 - #37092, inclusive:
  • Operator: Whiting
  • Field: Sanish (Mountrail)
  • Comments:
    • Whiting has permits for a 3-well Ness pad in section 21-154-91, Sanish oil field
One completed well:
  • 06900, multi-formation well; see belwo; New Horizon Resources, Harold Haugen 25-1, Divide County
Two permits canceled:
  • Slawson: one Gunslinger Federal permit in McKenzie County
  • Enerplu: one Walley permit in Dunn County
Four producing wells (DUCs) reported as completed:
  • 35415, 560, Kraken, Dragseth 9-4 6TFH, Winner oil field, t10/19; cum --;
  • 35416, 764, Kraken, Dragseth 9-4 5H, Winner oil field, t10/19; cum --;
  • 35426, 592, Kraken, Knox 16-21 5H, Winner oil field, t9/19; cum --;
  • 35427, 424, Kraken, Know 16-21 4TFH, Winner oil field, t09/19; cum --; 
***********************************
Harold Haugen Re-Entry Well
The well:
  • 6900, New Horizon Resources, LLC, Harold Haugen 25-1, Daneville, first drilled in 1979 - 40 years ago
Scout ticket:

Sundry form to re-enter:
  • approximate start date: August 15, 2019
  • plug Red River
  • enter/perforate: Stonewall/Gunton

New operator: January 19, 2018: change of operator from Earthstone Operating, LLC, to New Horizon Resources, LLC.

Recent monthly production:
PoolDateDaysBBLS OilRunsBBLS WaterMCF ProdMCF SoldVent/Flare
RED RIVER8-20191740176928000
RED RIVER7-201931922191427000
RED RIVER6-2019302701202000
RED RIVER5-2019301432141375000
RED RIVER4-2019275192791507000
RED RIVER3-20193012902067000
RED RIVER2-20190000000
RED RIVER1-20191000000
RED RIVER12-20183114601067000
RED RIVER11-20180000000
RED RIVER10-201817113224746000