The Bakken -- The Day President Trump Visits The Library -- Wednesday, July 1, 2026
Locator: 51085B.
Trump: note to my extended family -- YouTube, “The Hill” is televising the Trump visit to the Library now. On your desktop, open YouTube, and then search “News.” There will be other options but this is incredible right now.
Investing: this market is absolutely "insane" -- whatever that means, but it certainly is volatile. Link here.
Taxes:
California could enact "billionaire's tax" as soon as next year. Will vote later this year.
Governor Newsom does not want California to go down this road by itself; wants the "billionaire's tax" to be enacted at the federal / national level.
it's a pretty safe bet that a "billionaire's tax" won't happen at the federal level for the next three years or so
Newsome is concerned -- is California the next NYC, the next Denver?
The library: President Trump visits today. Open to the public as of July 4, 2026.
****************************** Back to the Bakken
WTI: $68.43.
New wells reporting:
Wednesday, July 8, 2026: 14 for the month, 14 for the quarter, 367 for the year,
41232, conf, Oasis, Hoehn 5202 41-24 5B
41231, conf, Oasis, Hoehn 5202 41-24 4B,
41230, conf, Oasis, Hoehn 5202 41-24 2B,
41194, conf, Oasis, Hoehn 5202 41-24 3B,
40624, conf, Devon Energy, Skaar 15-22 7H,
Tuesday, July 7, 2026: 9 for the month, 9 for the quarter, 362 for the year,
41620, conf, Devon Energy, Sanders 34-27 6H,
Monday, July 6, 2026: 8 for the month, 8 for the quarter, 361 for the year,
None.
RBN Energy: how the US upstream operations of the integrated majors compare with independent E&Ps. Link here. Archived.
For
decades, the major integrated oil companies have been judged by their
global scale, diversified business models and shareholder returns. Yet
one question is rarely asked: How competitive are their U.S. upstream
businesses when measured against independent E&Ps? In today’s RBN
blog, we provide answers that may surprise many investors.
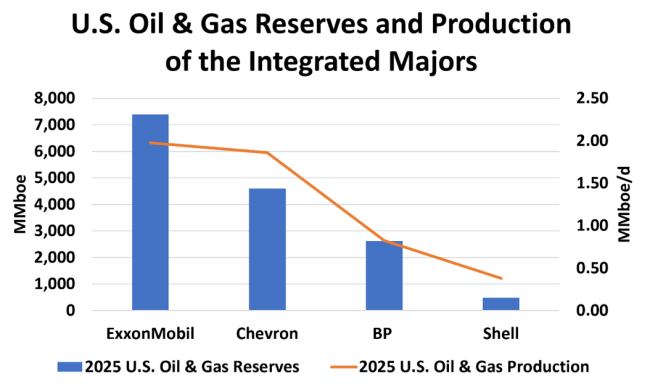
We
began our analysis by isolating the U.S. upstream operations of BP,
Chevron, ExxonMobil and Shell to examine where these assets fit within
each company’s global portfolio. ExxonMobil and Chevron are the two
largest U.S. producers with 2025 output of 2 MMboe/d and 1.87 MMboe/d,
respectively, outpacing independents Occidental Petroleum,
ConocoPhillips and EOG Resources. BP’s 2025 output was 824 Mboe/d,
approximately equal to Devon Energy (before this year’s merger with Coterra),
while Shell has by far the lowest U.S. footprint at 378 Mboe/d. We then
compared capital spending, reserves and operating focus before
benchmarking each company's U.S. upstream performance against comparable
independent E&P peer groups using standardized three-year operating
and financial metrics. The analysis highlights not only where the
majors are investing, but also whether those investments are generating
competitive upstream returns. Figure 1 below shows the relative size of
the four majors’ U.S. oil and gas reserves (blue bars and left axis) and
production (orange line and right axis) that are the subject of this
blog.
Figure 1. 2025 U.S. Oil and Gas Reserves and Production of the Integrated Majors. Source: Oil & Gas Financial Analytics LLC