Mailing large attachments. Link here.
MDW Investing: link here. New NDIC links: link here.
CPI: link here. PPI: link here. The PPI is a leading indicator for CPI.

Gasoline Demand (scroll to bottom at the link)
Refiner and blender adjusted net production of finished motor gasoline (bottom of the link)
Gasoline Demand (full table)
US Gasoline Production (full table, graph)
Weekly Petroleum Report
API: weekly US crude oil inventories
Flight radar:
Television calendar: link here.
Peter Zeihan newsletter. E-mail campaign archive. Mark Perry: Carpe Diem.
Calendar, Bureau of Economic Analysis.
DrillingEdge: link here. Grapevine High School: mustangs. Grapevine Lady Mustangs.
The Permian: link here.
Wuhan flu. The blog. Coronavirus: statistics. Seasonal flu: CDC.
Covid Data Tracker Weekly Review: link here, new. Covid data tracker: by community, new.
NASCAR: drive. Stock price: major oil companies.
SCOTUS, slip opinion, webpage. Texas relocation tracker: link here.
Automobile energy costs by state: link here.
On-line calculator: link here. Calculating an hypotenuse.
February 6, 2020: did URLs change for quarterly lease sales? They keep changing the URL and the website.
Williston Herald: Energy Chaser.
Saudi Arabia riyal to US dollar conversion: link here.
New link: powerful tool for locating rigs/wells in North America -- added December 5, 2018 -- highly recommend:
- North American rig location -- as of December 5, 2018; a really, really good site
- Rigs and Wells in North Dakota -- same link
- Rigs and Wells in Canada -- same link
The unexpectedly high crude inventories have been telling me that [US crude oil] production has been under reported; line 13 of the weekly U.S. Petroleum Balance Sheet (unaccounted for crude) has been averaging north of 500,000 bpd for two months: https://www.eia.gov/petroleum/supply/weekly/pdf/table1.pdf
Production + imports - exports should equal oil refined + oil stored.
My guess is that US production has been running over 12 million bopd at least a couple weeks now.
Visualizing US shale oil production: shaleprofile.com.
Oil field jargon. Bakken spot price. LSS -- DAPL-Bakken proxy.
Futures expiration calendar.
Top 100 oil fields in the US, March, 2015. GDPNow.
S&P Global Platts -- the "periodic table of oil." Third iteration here, December 10, 2020.
FracFocus. Calculating sand weight. Water gallons to pounds conversion, on-line. Or here.
Legacy Fund. Legacy Fund financial statements. US import / export data.
North Dakota state budget. Bakken daily price. Tesla bonds. Futures: oil contracts.
To get WTI future contract price, go to Marketwatch upper left, click on" Oil," scroll down and there are WTI contract prices for the next 12
months.
NDDOT.
ISO New England. ISONY. ISO California. ISO Price California. ISO Australia.
ERCOT TX. ERCOT Hourly Loads State Profiles ERCOT pricing.
Oil: periodic table of oil -- Platts.
NOVI Labs, Enno Peters: Bakken update.
EIA dashboards:
- natural gas storage
- EIA pdf, Bakken: https://www.eia.gov/petroleum/drilling/pdf/bakken.pdf
- EIA, pdf, Permian: https://www.eia.gov/petroleum/drilling/pdf/permian.pdf
- EIA, pdf, Eagle Ford: https://www.eia.gov/petroleum/drilling/pdf/eagleford.pdf
Historical price of WTI.
Understanding BOE, Motley Fool: how to convert "mcf" natural gas to barrels of equivalent oil (boe).
Economic Calendar.
- FRED:
Rail
- EIA: the "914s"; the monthlies; the most accurate production data - US Field Production of Crude Oil;
- EIA: Weekly Petroleum Status Report (comes out Wednesdays, 10:30 a.m. ET)
- API: US crude oil inventory forecast (comes out at 4:30 ET, Tuesdays)
- EIA: Crude oil production, yearly
- EIA: Crude oil production, weekly, estimates
- EIA: Crude oil production, monthly, actual
- EIA: Crude oil production, monthly, EIA-914; end-of-month release of the EIA-914
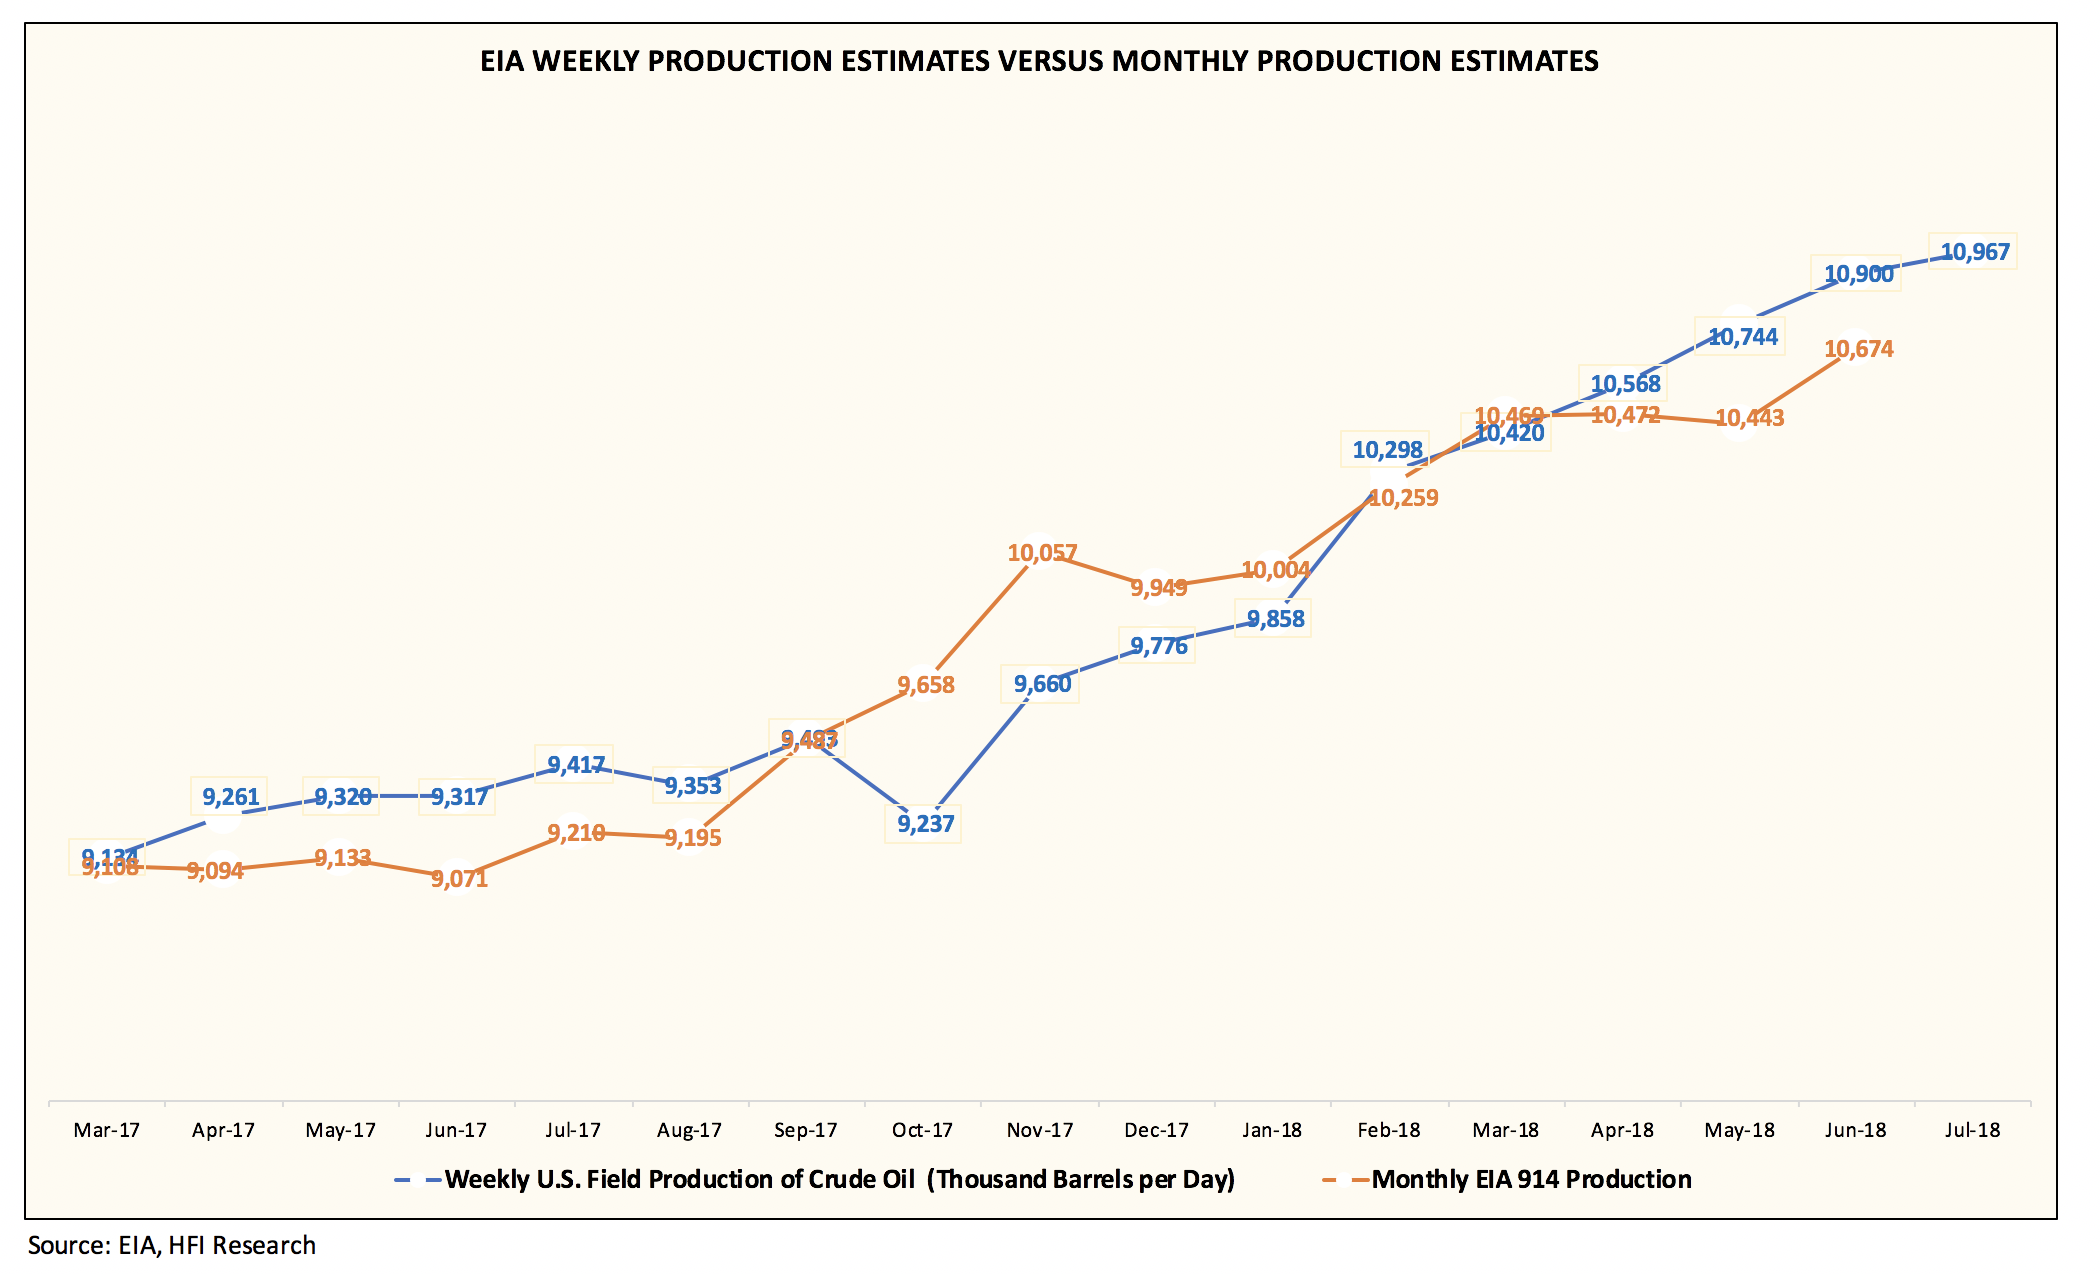
- EIA: Crude oil production, weekly estimates vs official monthly data (see this post)
- EIA: US crude oil inventory, total, excluding SPR
- EIA: US total crude oil + petroleum products;
- EIA: Days Supply
- EIA: Long term projections -- 2010 presentation and outlook
- EIA: US crude oil exports
- EIA: US natural gas exports (includes pipelines to Mexico, Canada)
- EIA: US ethane - ethylene exports
- EIA: US propane - propylene exports
- EIA: gasoline imports in the US
- EIA: Oil imports into the US
- EIA: Oil imports into the US from Saudi Arabia
- Non-EIA: Saudi Arabia production
Maps and Metrics
- By the numbers, removed January 11, 2015
- Quick-pick news, removed January 11, 2015
- Global warming, January 11, 2015