Locator: 50542RBN.
... I need to catch up on two RBN Energy stories; both are early access stories. If I don't catch them, I could miss them.
First, early release, Thursday, April 16, 2026 -- link here. RBN Energy. Nashville’s Growth Boom Could Have a Big Impact on Regional Fuel Supply -- archived:
Nashville is best known for its country music, but it’s also a fast‑growing gasoline and diesel market, uniquely positioned between the Gulf Coast and the Midwest. As the city rolls out massive plans for development — including an expanded entertainment complex and a new NFL stadium — space is getting tight along the Cumberland River, where several fuel terminals cluster. In today’s RBN blog, we’ll look at how Nashville’s rapid growth could reshuffle product flows and what that means for refiners, marketers and shippers.
Nashville has no refineries of its own but serves as a terminal and distribution hub for gasoline, diesel and jet fuel across Middle Tennessee — the state’s middle third — and into neighboring states, allowing it to play an outsized role in the regional refined products market. The 2.5‑MMb/d, 5,500-mile Colonial Pipeline system, in service since 1963, runs from Houston to Linden, NJ (just outside New York City), and has many stub lines that branch out to supply cities that aren’t on the main route. Nashville depends on those stub lines to move barrels from Gulf Coast refineries into Middle Tennessee, while Colonial’s mainlines continue on to serve Southeast and Mid‑Atlantic markets.
There are three Colonial stubs that extend northwest from the main pipeline’s Atlanta junction in northwestern Georgia to Chattanooga. From there, two parallel stub lines — one carrying only gasoline and the other batching diesel and jet fuel (blue lines in Figure 1 below) — extend northwest to Nashville, while the third (not shown) runs northeast to Knoxville. Nashville’s 10 large refined product terminals are primarily supplied by Colonial’s stub and spur lines. (In its documents, Colonial defines “stub lines” as those extending from the main line, while “spur lines” are for local delivery off the system.)

Figure 1. Nashville Refined Products Terminals and Development Projects. Source: RBN
*********************************
Second, Wednesday, April 15, 2026, Will Surging Cash Flows Tempt Still-Disciplined E&Ps to Ramp up Spending? Link here. RBN Energy. Archived.
Weak Q4 2025 results provided a timely check-in on how upstream E&Ps were allocating capital in a lower-price environment — just before a sudden commodity price tailwind in 2026 from the onset of Middle East hostilities. Managements have said they would stick to the capital discipline that won back the hearts and wallets of investors; however, surging oil and gas prices this year are putting more cash back into E&P coffers. In today’s RBN blog, we analyze the Q4 2025 cash allocation of U.S. E&Ps and address the question: Will discipline hold, or will temptation take over?
Across our universe of 35 companies, cash flow from operating activities (CFOA) declined 12% in Q4 2025 from the previous quarter to $24.7 billion, reflecting weaker oil prices. Despite that pressure, capital allocation priorities remained largely intact. Capital spending fell modestly to $15.3 billion, or approximately 62% of cash flow, preserving a reinvestment framework that has become increasingly embedded across the sector over the past several years.
The resulting $9.4 billion of free cash flow (FCF) — while down from the prior quarter — continued to be deployed in a balanced manner. Companies shifted toward net asset sales, generating $1.8 billion of net proceeds, while also resuming debt-reduction efforts with $2.2 billion of net repayments. Shareholder returns remained a core priority, with dividends and share repurchases accounting for 11% and 15% of CFOA, respectively, underscoring the durability of return-of-capital frameworks even in a softer pricing environment. These trends were broadly consistent across our Oil-Weighted, Diversified and Gas-Weighted peer groups, highlighting just how ingrained this capital discipline has become.
Taken together, Q4 2025 reinforced a broader structural shift in the industry — away from growth-at-all-costs and toward a more measured, cash-return-focused model. That evolution is illustrated clearly in Figure 1 below, which shows how reinvestment rates (blue bars and left axis) have converged over time to a rough 60% of cash flow, with the balance directed toward debt reduction, shareholder returns and opportunistic transactions. Even as commodity prices softened in recent years, companies resisted the urge to chase volumes, instead scaling back capital spending to preserve this framework.
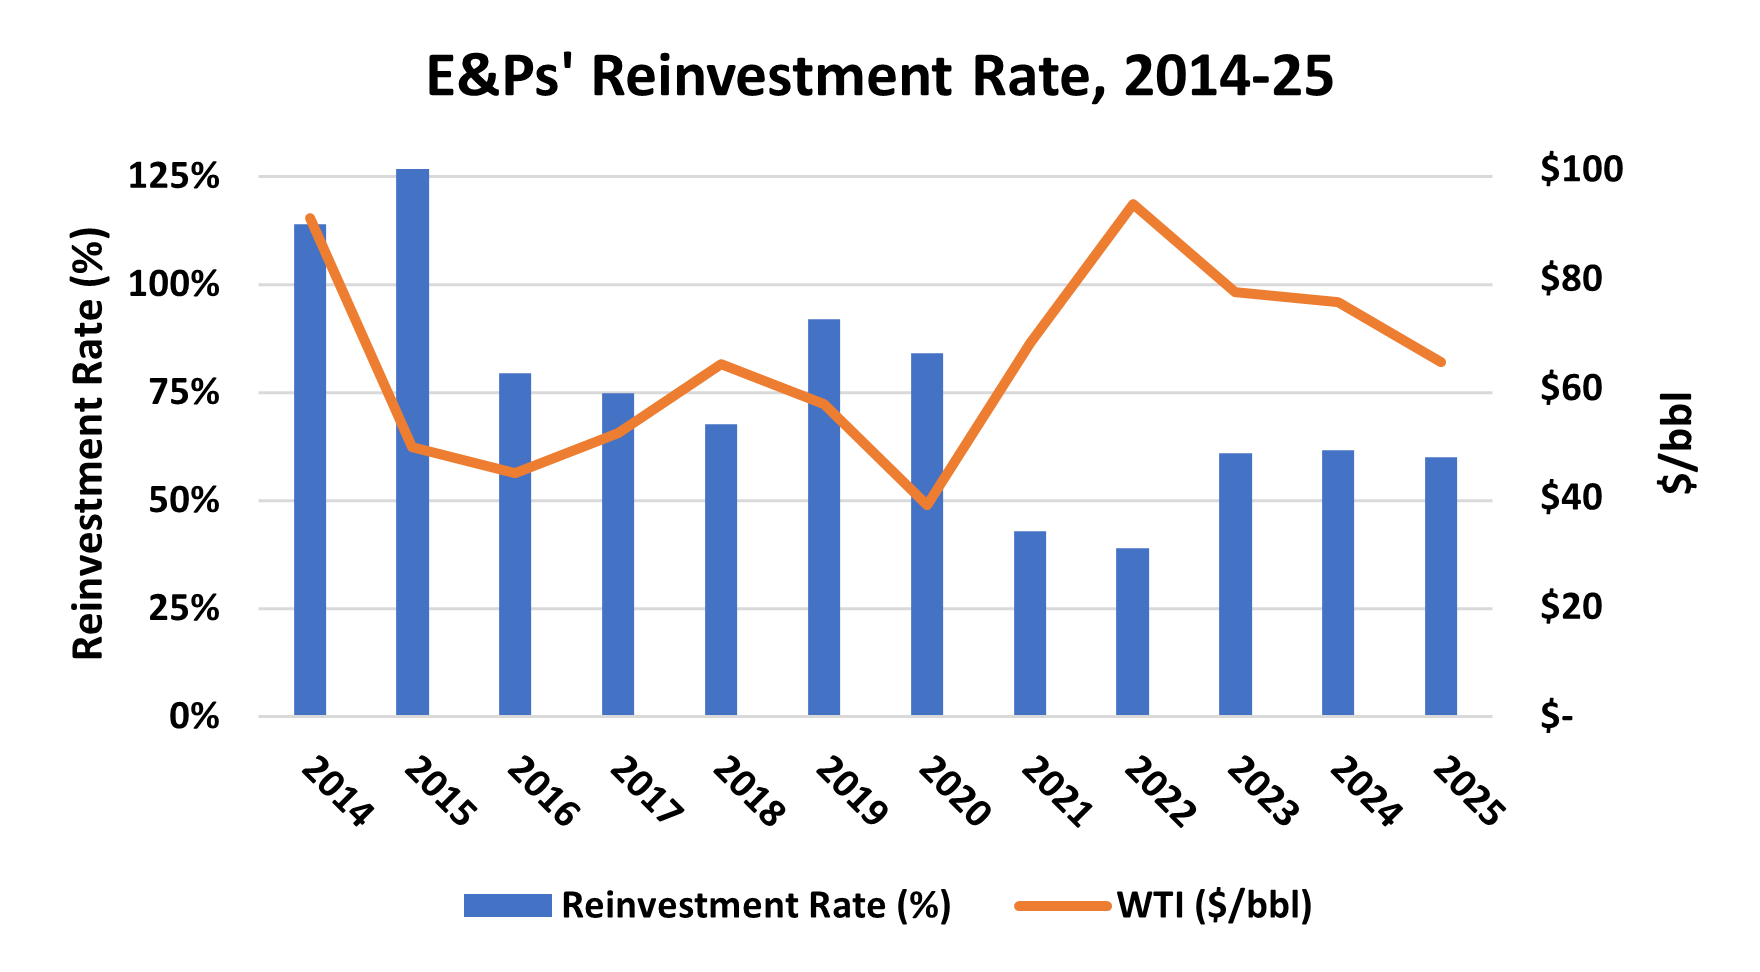
Figure 1. E&Ps’ Reinvestment Rate, 2014-25.
Source: Oil & Gas Financial Analytics LLC