This is Page 4
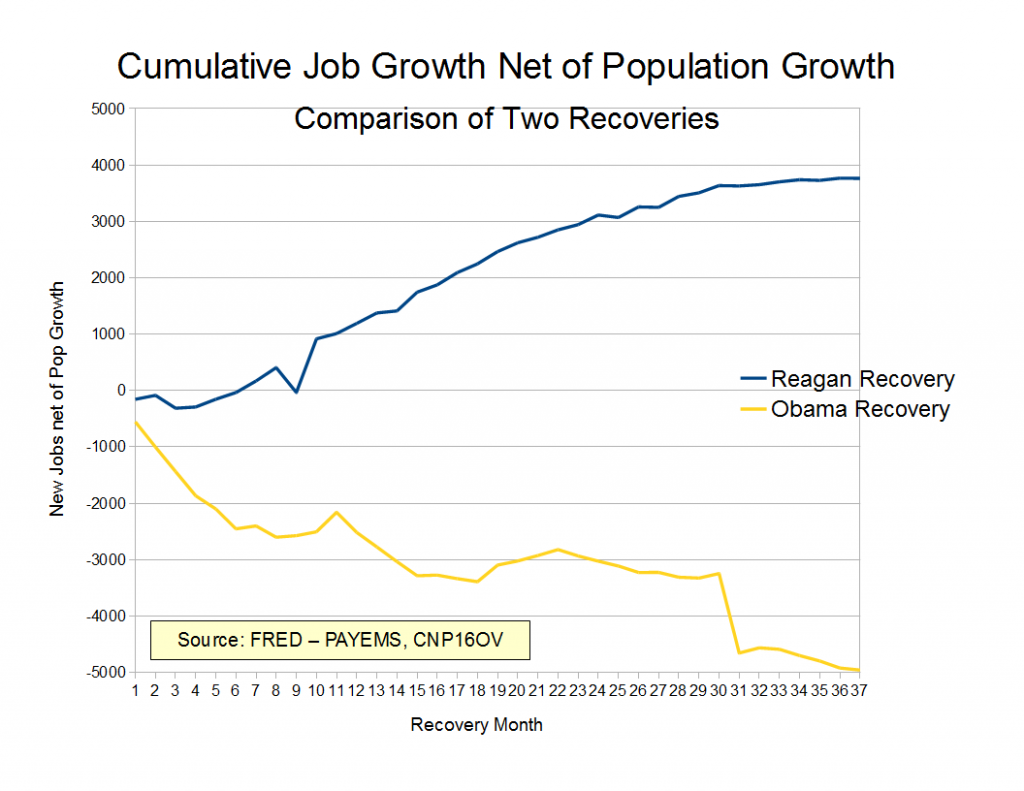
Reagan vs Obama: job recovering following a recession. Reuters and Bloomberg keep telling us job growth is strong, but never seem to really back up that assertion.
The Magic Numbers
First time claims, unemployment benefits: 400,000 (> 400,000: economic stagnation)New jobs: 200,000 (< 200,000 new jobs: economic stagnation)
Economists estimate the labor market needs to create about 125,000 jobs a month to keep the unemployment rate steady, though estimates vary -- Reuters.I will stick with 200,000 (the "magic number" prior to the Obama administration) -- it's a nicer, "rounder" number to remember.
Over the two years that I had been posting these updates, it had become clear/obvious that the figures were often suspect, if not outright falsified. On November 18, 2013, it was reported that, indeed, unemployment figures have been falsified.
In the home stretch of the 2012 presidential campaign, from August to September, the unemployment rate fell sharply — raising eyebrows from Wall Street to Washington.Take the numbers for what they are worth, I guess. Not much. As so much else with ObamaNation.
The decline — from 8.1 percent in August to 7.8 percent in September — might not have been all it seemed. The numbers, according to a reliable source, were manipulated.
And the Census Bureau, which does the unemployment survey, knew it.
Updates
September 2, 2016: the Goldilocks number. Jobs created in August much less than forecast; unemployment unchanged from a revised upward revision one month earlier.
September 1, 2016: increases 2,000; up to 263,000; four-week average dropped to 263,000.
August 25, 2016: slipped 1,000; down to 261,000. Four-week average dropped 1,250, to 264,000.
August 18, 2016: falls by 4,000; down to 262,000. Four-week average increased 7,750.
August 11, 2016: fell by a 1,000 from a revised 267,000 to 266,000.
August 4, 2016: the news is not getting any better. Analysts expected first time claims to drop. In fact they rose to 269,000. Four-week average also rose to 260,250. In addition, layoffs spiked for the second straight month in July, mostly due to the energy sector.
July 28, 2016: huge miss by Bloomberg. Claims jump 14,000 to 266,000.
July 21, 2016: prior, 254K; consensus, 265K (a rise of 11,000 forecast); actual: 253K, a decline of 1,000. Four-week moving average: 257,750. From Econoday, the consensus was based on the "usual" summer auto-retooling layoffs.
All the readings in this report are very low, arguably at the lowest levels on record. But the missing piece is this summer's auto retooling which, when it appears, may have an outsized reverse effect on the data. The Labor Department says there are no special factors in today's report, one which points to a second month of strength for the monthly employment report.
July 14, 2016: unchanged at 254,000.
July 8, 2016: "vigorous rebound" according to The New York Times; 287,000 jobs added; unemployment rate up slightly to 4.9%
July 7, 2016: tumble 16,000 to 254,000; four-week average dipped slightly to 264,750. It looks like we may have finally turned the corner.
July 2, 2016: jumped 10,000 to 268,000 (previous week revised downward by 1,000). Four-week moving average remained unchanged at 266,750, which is interesting considering the previous week, first time claims plummeted 18,000 to 259,000.
June 23, 2016: declined more than forecast. First time claims plummeted by 18,000 to 259,000. Survey called for a decline to 270,000. Four-week average: down to 267,000, from 269,250 a week earlier.
June 16, 2016: surges 13,000 to 277,000, highest in four weeks; 4-week moving averaged declined 250 to 269,250, based on an anomaly a few weeks ago.
June 9, 2016: dropped 4,000 to 264,00; previous week must have been revised upward to 268,000. 4-week moving averaged dropped 7,500 to 269,500.
June 2, 2016: horrendous job report for the month of May; US added only 34,000 jobs; [revised downward to 11,000 -- almost impossible to believe -- link here]; unemployment rate plunges to 4.7% from 5.0% as more Americans drop out of workforce.
June 2, 2016: fell 1,000 to seasonally adjusted 267,000. Four-week average fell to 276,750.
May 26, 2016: dropped 10,000 to 268,000; 4-week moving average increased to 278,500.
May 19, 2016: 278,000, a decrease of 16,000; 4-week moving average was 275,750, an increase of 7,500 from the previous week.
May 12, 2016; second consecutive horrendous weekly report -- unexpectedly surges; jumps by 20,000 to 294,000, highest since February, 2015; four-week rolling average jumps to 268,250 from 258,000.
May 6, 2016: April jobs report. One word: Awful. Actually, worse than awful. Atrocious.
May 5, 2016: surges; way more than expected; up 17,000 from last week; 14,000 more than forecast; 274,000 new claims vs forecast of 260,000; 4-week rolling average up 2,000 to 258,000. Sixty-one weeks with claims under 300,000.
April 28, 2016: up 9,000. Four-week average: 256,000, a 42-year low.
April 21, 2016: huge miss by analysts -- down 6,000. Forecast: 265,000 (previous 253,000). Actual: 247,000. Forecast was for a 12,000 increase; in fact, dropped 6,000. Four-week rolling average: 260,500.
April 14, 2016: plummeted; down 13,000 to 253,000 from last week's revised 266,000 figure. The four-week rolling average fell 1,500 to 265,000 last week.
April 7, 2016: fell 9,000 to 267,000. The four-week average, a less-volatile figure, rose 3,500 to 266,750.
March 31, 2016: first time claims surge unexpectedly! Up 11,000 from previous week. New apps at 276,000. The four-week average rose 3,500 to 263,250.
March 30, 2016: new jobs for March, 200K, in-line with economists' forecasts.
March 17, 2016: jump 7,000 to 265,000; four-week average increased 750 to 268,000.
March 10, 2016: applications plummet by 18,000; down to 259,000. Four-week average down 2,500 to 267,500.
March 4, 2016: new jobs in February, 242K vs 190K forecast; unemployment unchanged at 4.9%.
March 3, 2016: up 16,000 in last two week. Jumps another 6,000 this past week, to 278,000, vs consensus of 270,000. The forecast was for a drop from the previous week. Actually increased. Four-week average drops to 270,250 due to anomalies a few weeks ago.
March 2, 2016: US private sector adds 214,000 jobs in February -- ADP. Average forecast: 190,000.
February 25, 2016: jumps 10,000 to 272,000. Surprisingly, no revision of last week's "huge" estimate (LOL). Four-week average also dropped, now at 272,000. Unemployment rates in 2015 were lower than recession rates in 2007 in only 14 states, including North Dakota; most of the 14 states were in the Midwest; none were on the east coast or west coast. None..
February 18, 2016: claims drop by 7,000 to 262,000. Four-week average down to 273,250. These numbers will have to be revised next week because numbers from Pennsylvania, Virginia, and Puerto Rico were estimated.
February 11, 2016: fell 16,000 to 269,000. Huge drop; no explanation. Four-week average fell 3,500 to 281,250.
February 4, 2016: forgot to record; must have jumped a bit from 278,000 to 285,000 based on the numbers for the following week (February 11, 2016).
January 28, 2016: fell 16,000 to 278,000 from 294,000 which was revised upward from last week; four-week average at 283,000 from a revised 285,250 last week.
January 21, 2016: huge "swing and a miss"; up almost 20,000 more than forecast; at 293,000; also, the 4-week average up significantly to 285K from a prior revised 278,500.
January 14, 2016: an increase of 7,000 to 284,000; forecast, 275,000.
January 8, 2016: payroll growth surged in December, up 292,000 vs projected 200,000. Comes on top of surge in November. Unemployment rate holds steady at 5%; full employment. David Stockman suggests the "292,000" is completely bogus. The payroll number is "seasonally adjusted." The actual raw data was 11,000; the government added another 281,000 jobs through "seasonal adjustment," no doubt the same algorithm used to project global warming 100 years from now.
January 7, 2016: great jobs report today. The number comes in at 277,000, a decrease of 10,000 or 3.48% from last week. The 4-week moving average was 275,750, a decrease of 1,250 from the previous week's unrevised average of 277,000.
December 31, 2015: applications surge; up 20,000; now at 287,000. four-week rose 4,500. One has to go back almost a year, back to January, 2015, to see numbers (287,000) this high.
December 24, 2015: dropped more than expected. Down to 267,000; four-week rose 1,750 to 272,500.
December 17, 2015: plummeted by 11,000 t0 271,000. Four-week little unchanged at 270,500.
December 10, 2015: number of claims for unemployment benefits rise to a 5-month high; surged 13,000 to 282,000. Four-week: rose 1,500 to 270,750.
December 3, 2015: forgot to post; must have been 269,000 based on December 10, 2015, data. If that is accurate, that was a rise of 9,000 this past week. Four-week must have been 269,250.
November 25, 2015: plummeted 12,000 to 260,000; previous week revised upward to 272,000; 4-week average held steady at 271,000.
November 19, 2015: decreased 5,000 to 271,000. Four week average rises 3,000 to 270,750.
November 12, 2015: unchanged at 276,000. Four week average rises 5,000 to 267,750.
November 5, 2015: completely unexpected; expectation was that there would be an increase of 2,000; in fact, first time claims surged 16,000 to 276,000. The surge was so big that it affected the four-week average which rose to 262,750.
October 29, 2015: lowest in 42 years; slight rise, to 260,000; four-week average, 259,250.
October 22, 2015: slight rise, up 3,000 to 259,000 (last week's number was revised up 1,000). Four-week moving average best since late 1973, at 263,250.
October 15, 2015: last week, revised down 1,000, to 262,000. This week, plummets again, to 255,000, a decrease of 7,000. Four-week average was 265,000, a decrease of 2,250 from previous revised average. Best number since December 15, 1973.
October 8, 2015: first-time unemployment claims plummet. Drop 13,000 to 263,000; four-week average dropped to 267,500.
October 2, 2015: job creation plummets.
October 1, 2015: surged 10,000 to 277,000. Expectations, 271,000. Four-week average dropped to 270,750.
September 24, 2015: background noise; claims up slightly, 3,000 to 267,000. Four-week average dips lightly.
September 17, 2015: unexpected plunge to 264,000; drops 11,000. Four-week average fell 3,250 to 272,500.
September 4, 2015: wow, wow, wow. Shocking! Atrocious number. New jobs -- only 177,000.
September 3, 2015: surges; up 12,000; far exceeds forecast; to 282,000. The 4-week moving average was 275,500, an increase of 3,250.
August 27, 2015: three-week low; decline 6,000 to 271,000; four-week average rose to 272,500.
August 20, 2015: rose 4,000 to 277,000. Analysts had expected a decline.
August 13, 2015: rise "unexpectedly" by 5,000 to 274,000; four-week average fell 1,750 to 266,250 last week, the lowest since April 2000.
August 6, 2015: Initial unemployment claims increase by 3,000 to 270,000. In line with forecasts. That's on top of the 12,000 increase last week.
July 30, 2015: Reuters reports that jobless claims increase, but "still near" cycle lows. Actually, the number surges, up 12,000. The four-week average fell 3,750 (due to last week's anomalous report) to 274,750.
July 23, 2015: even Reuters knows the number is bogus. Plunged 26,000 to 255,000; the expectation had been for 283,000. Lowest since 1973. Four-week moving average fell only 4,000 to 278,500.
July 17, 2015: Jobs: first time unemployment applications plunge by 15,000; now down to 281,000. The four-week figure rose 3,250 to 282,500.
July 9, 2015: claims surge 15,000 to 297,000 (previous week was revised upward by 1,000); four-week average rose 4,500 to 279,500. The four-week moving average of claims, which smooths out week-to-week fluctuations and is therefore considered a better gauge of the labor market, rose 4,500 to 279,500 last week.
July 2, 2015: claims surge 10,000 to 281,000; a 5-week high; four-week average increases by 1,000 to 274,750.
June 25, 2015: claims rise 3,000 to 271,000; four-week average falls 3,250 to 273,750.
June 19, 2015: unemployment rates fall in only nine (9) states; rise in 25 states; flat in the rest.
June 18, 2015: claims drop 12,000 to 267,000; a 15-year low. Four-week average drops 2,000 to 276,750.
June 4, 2015: claims plummet 8,000 to 276,000 from a revised 284,000 the prior week. The revision was 2,000 more than previously reported. The four-week average of applications, a less-volatile measure than the weekly figure, increased to 274,750 from 272,000 in the prior week.
May 28, 2015: claims surge unexpectedly; back to 282,000; four-week average surges by 5,000.
May 21, 2015: surges; rises 10,000, slightly above expectations, to 274,000. Four-week average fell by 5,500 to 266,250.
May 14, 2015: Weekly applications fell 1,000 to a seasonally adjusted 264,000 last week. That is just above a 15-year low reached three weeks ago. The average, a less volatile figure, dropped 7,750 to 271,750, the lowest in 15 years.
May 7, 2015: Jobless claims increased by 3,000, fewer than expected, to 265,000. The four-week average fell to 279,500.
April 30, 2015: doesn't add up, but it is what it is. Plummeted 34,000 to 262,000; four-week average fell 1,250 to 283,750.
April 16, 2015: surged by 12,000, to 294,000; four-week average, 282,750.
April 9, 2015: surged by 14,000 to 281,000.
April 3, 2015: huge miss on jobs report -- note the magic numbers above. Forecast: 245,000 new jobs. Actual: 126,000 -- almost half of what was forecast.
April 2, 2015: continuing claims at 15-year low. Last week's numbers revised slightly up to 288,000. But the new number, 268,000, completely blew away expectations of 288,000. Four-week average: 2,325,000.
March 26, 2015: down 9,000 from the week before, much, much better than the consensus; claims drop to 282,000; four-week moving average fell 7,750 to 297,000, back under the all-important milestone of 300,000.
March 19, 2015: claims up 1,000 to 291,000; the four-week average, a less volatile measure, increased 2,250 to 304,750
March 5, 2015: unemployment claims unexpectedly surge to 320,000 from 313,000 the prior week. The four week moving average jumped 10,250 to 304,750.
March 4, 2015: U.S. private employers added 212,000 jobs last month. Not bad, but not great, considering we should be into a huge recovery by now.
February 26, 2015: surges 31,000 to 313,000; completed unexpected; far outside the forecast. The 4-week average is up 11,500 to 294,500. The previous week number was revised from 283,000 to 282,000.
February 19, 2015:
dropped 21,000 last week to a seasonally adjusted 283,000. The four-week
average of applications, a less volatile number, fell 6,500 to 289,750,
its lowest level in 15 weeks.
February 12, 2015: new claims surge; rise way more than expected; up to 304K; four-week average decreased to 289,750 (due to spurious unemployment claims of a couple weeks ago).
February 5, 2015: new claims lower than expected; 278,000 (up 11,000); four-week average, 292,750.
February 4, 2015: number of new jobs added in private sector falls short; only 213,000; less than forecast.
January 29, 2015: the number seems very, very fishy. Plunged by 43,000 to 265,000 in the week
ended Jan. 24, the lowest since April 2000. Previous week revised up by 1,000 to 308,000. The four-week average of claims, a less-volatile measure
than the weekly figure, dropped to 298,500 from 306,750 in the
prior week.
January 22, 2015: four-week average surges 6,500 to over 300,000 (306,500); the previous week numbers were revised upward by another 1,000 claims. This week's number decreased unexpectedly by 10,000.