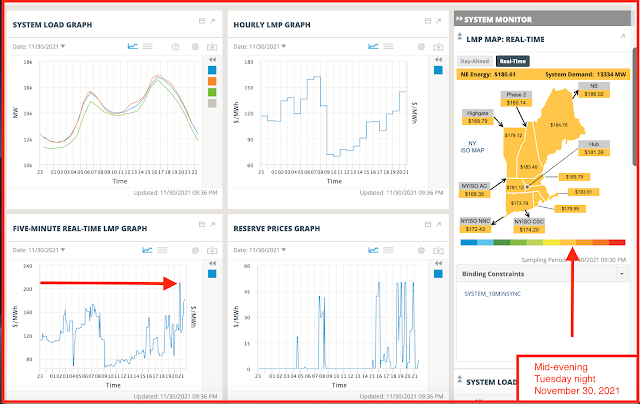
Here are the costs, 7th decile, and trending toward the 8th decile ($201 - $500 / MWh):
Here is the fuel mix:
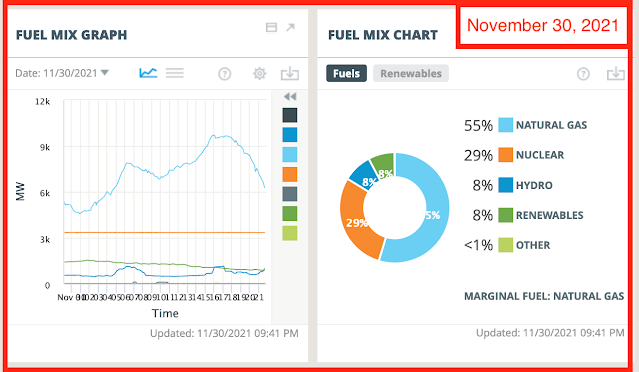
What jumps out at you when you compare the "costs" with the "fuel mix"?
A reader posits the following to explain this phenomenon:
As I also have been closely following the New England electricity 'drama', I have been a little puzzled as to why the spot pricing has been so high between ~1 AM and ~6 AM as the demand is relatively low.
Although not 100% certain, I think I understand what is unfolding.Components ...1. Day Ahead/Cleared pricing2. Status of 'Renewables' (sic) ... if the wind be 'ablowin'3. Temperature (translates into the price AND availability of natgas)4. Competitive game of 'chicken' amongst hydro, natgas, coal, and oil burning generatorsSummary (includes a bit of informed speculation) ...
1. The Day Ahead pricing (can be seen on the chart 'LMP Map: Real Time' by clicking non-default tab 'Day Ahead' tab which is next to default 'Real Time' tab) is what the ISO folks contract with the various generators as to how much, and at what price, electricity will be available at that time on the next day. These are 'micro sliced' into 5 minute increments.This amount is reflected by the green line in the first chart 'System Load' and labelled 'Cleared'.2. The wind contribution (sic) has been relatively low these past few weeks (this has been a BIG contributing factor in Europe's and the UK's current predicament ... grossly under reported by MSM).This can easily be seen, albeit not in detail, in the 'Fuel Mix Graph' by the green line. (Precise amounts can easily be found by clicking the non-default setting of the 3 grey horizontal lines which is next to the default 'graph' setting [right angle with squiggly line]. The precisely generated amounts are displayed in ~10 minute increments and labelled by source, ie., nuclear, wind, NaturalGas LandfillGas, etc.).3. Now, come midnight to, say, 6 in the morning, the temperatures have been cold throughout New England these past few weeks.Consequences? Very high consumption by customers for heat-generating purposes. This is crucial ... the customers of natgas get priority for the available natgas - they have paid for the pipes via their monthly billings. About 5 1/2 Bcfd flows into New England. Power plants reliant upon piped natgas simply cannot be guaranteed supply. Some DO have onsite, back up fuel oil, but this is both limited and expensive.Bottom line, look to 10 day temperature forecasts to sense the overnight electricity pricing.Wind forecasts also play a role, but - my experience - far from precise.4. Power generators (hydro versus oil-burners) can bid against one another to obtain as high a price as they can in the Spot Market while also satisfying reliability requirements of ISO, that is, they are able to generate electricity on short notice.If you look at the current 'Fuel Mix Graph', you will see a tiny input at the 5 and 8 AM times for 'Oil' sourced.Likewise, the high price spikes on the 'Five Minute Real-Time LMP Graph' coincides with the input spike in 'Hydro' production.Essentially, any provider of electricity will jump in and produce if the fuel is available (natgas/fuel oil/coal) AND a profitable outcome is achievable.Bottom bottom line ... the New England folks have boxed themselves into an extremely precarious corner whereby they are now competing - with a global market, no less - for means of 'normal' electricity supplies (forget about affordable ... way too late), and this is highly dependent upon weather conditions.This is EXACTLY what Australia, California, Germany, AND the UK have all experienced or are right now experiencing.That it seems to be coming as a surprise is, in itself, the biggest surprise.