U.S. commercial crude oil inventories (excluding those in the Strategic Petroleum Reserve) decreased by 6.5 million barrels from the previous week. At 475.4 million barrels, U.S. crude oil inventories are in the upper half of the average range for this time of year.
Total motor gasoline inventories increased by 3.4 million barrels last week, and are in the upper half of the average range. Both finished gasoline inventories and blending components inventories increased last week.
Distillate fuel inventories decreased by 1.7 million barrels last week but are in the upper half of the average range for this time of year. Propane/propylene inventories remained unchanged last week and are in the lower half of the average range. Total commercial petroleum inventories decreased by 4.6 million barrels last week.
My calculations (parameters previously described) suggest that at the average rate of decline over the past 15 weeks, it will take 35 weeks to "re-balance":
Week
|
Date
|
Drawdown
|
Storage
|
Weeks to RB
|
Week 0
|
Apr 26, 2017
|
529.0
|
180
|
|
Week 1
|
May 3, 2017
|
0.9
|
528.0
|
198
|
Week 2
|
May 10, 2017
|
6
|
522.0
|
50
|
Week 3
|
May 17, 2017
|
1.8
|
520.2
|
59
|
Week 4
|
May 24, 2017
|
4.4
|
515.8
|
51
|
Week 5
|
May 31, 2017
|
6.4
|
509.9
|
41
|
Week 6
|
June 7, 2017
|
-3.3
|
513.2
|
60
|
Week 7
|
June 14, 2017
|
1.7
|
511.5
|
57
|
Week 8
|
June 21, 2017
|
2.5
|
509.0
|
62
|
Week 9
|
June 28, 2017
|
-0.2
|
509.2
|
71
|
Week 10
|
July 6, 2017
|
6.3
|
502.9
|
58
|
Week 11
|
July 12, 2017
|
7.6
|
495.3
|
47
|
Week 12
|
July 19, 2017
|
4.7
|
490.6
|
43
|
Week 13
|
July 26, 2017
|
7.2
|
483.4
|
38
|
Week 14
|
August 2, 2017
|
1.5
|
481.9
|
37
|
Week 15
|
August 9, 2017
|
6.5
|
475.4
|
35
|
Other highlights:
- US refinery throughput hit a record: 17.6 million b/d; an increase of 166,000 b/d compared with the prior week
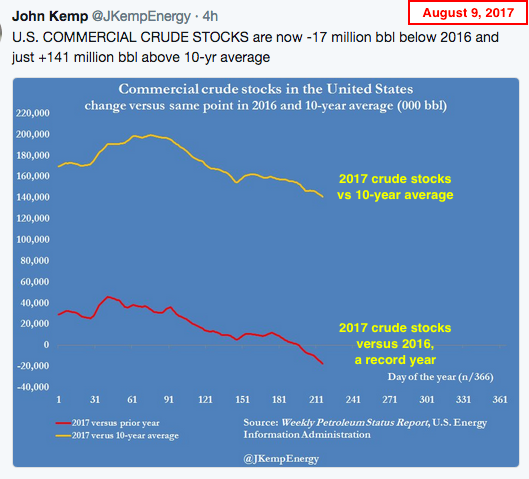
- US commercial crude stocks fell 6.5 million bbls to 475 million bbls; much faster than normal for this time of year
- US commercial crude stocks exhibiting largest summer seasonal draw since 2014
- US gasoline stocks now 5 million bbls below 2016 (a record year); the previous week the number was 11 million bbls below 2016
- John Kemp works hard at putting the Reuters spin on all this. From Kemp, via Twitter: US gasoline supplied averaged 9.8 million b/d last week which was just 28,000 b/d higher than 2016 (fails to mention that 2016 was a record year overall)