Locator: 48440B.
US Supreme Court: backs Trump on fired federal workers.
Tariffs: the real story is about imbalance of payments.
- tariffs: the metric that will be followed -- balance of payments between the US and any one country.
- Quick! How are other countries negotiating with Trump to manage some of that imbalance in the short term. Again, Trump's economic plan has short term goals and long term goals.
Huge stories: deportation rulings by US Supreme Court.
- now: Judge Boasberg abruptly cancels hearings; did not know he did not have jurisdiction!
- links everywhere; everyone will spin the story differently
- ends hopes of a US Supreme Court nomination, although unlikely anyway at his age

*********************************
Back to the Bakken
WTI: $60.51.
New wells:
- Wednesday, April 9, 2025: 35 for the month, 35 for the quarter, 242 for the year,
- 40902, conf, CLR, Entzel 3-14H,
- 40153, conf, Hess, EN-Engebretson-157-94-1003H-3,
- 40152, conf, Hess, EN-Engebretson-157-94-1003H-2,
- 39039, conf, Grayson, Orville 4-9 3H,
- Tuesday, April 8, 2025: 31 for the month, 31 for the quarter, 238 for the year,
- 40924, conf, CLR, Entzel 2-14HSL,
- 40913, conf, BR, Cleetwood 7A,
RBN Energy: Arrow Model forecasts shifts in gas flows, basis as new pipes, LNG capacity arrives. Archived.
The rapid growth in U.S. natural gas production and LNG exports over the past 10 years was just the beginning. Between now and 2035, gas production in the Permian, Eagle Ford, Haynesville and other plays will continue rising, the Gulf Coast’s LNG export capacity will double and many new pipelines will be built. New gas-fired power plants will be added, too. The shifts in gas flows as new production and infrastructure come online will be frequent and often sudden, as will the changes in basis at gas hubs throughout Texas and Louisiana. Is there any way to make sense of it all? There sure is. In today’s RBN blog, we continue to explore how our Arrow Model helps guide the way.
Few, if any, would argue with the view that the world is changing at a breakneck pace and that there are many “unknowable unknowns” out there. But this much seems clear: (1) the more than 8 billion people on this planet will need more energy; (2) natural gas is among the cleanest, most abundant forms of reliable, around-the-clock energy supply; and (3) the U.S. has super-abundant gas reserves and the means to export vast amounts of LNG to Asia, Europe and other major gas-consuming regions. The question is, how will the era of U.S. gas/LNG dominance unfold, particularly in Texas and Louisiana, the two states at the center of most of the action.
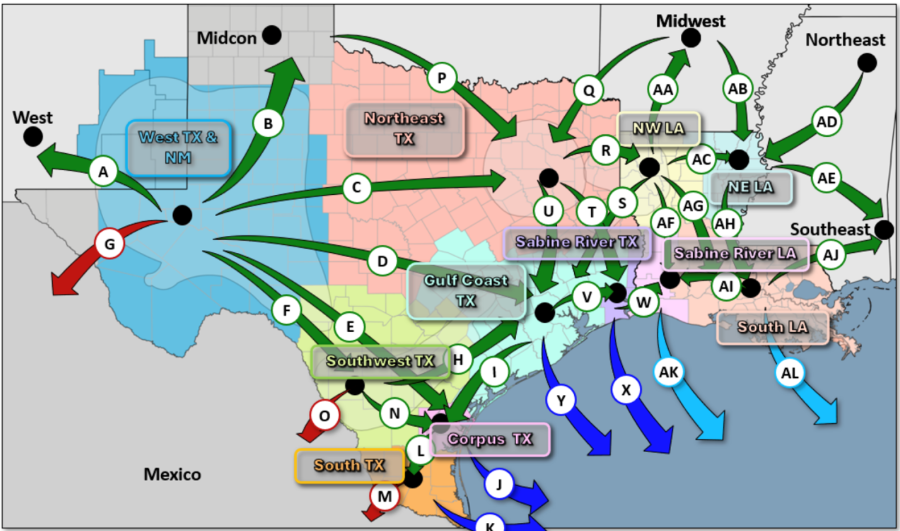
In Part 1, we summarized where things stand today regarding gas production, pipeline development and LNG export capacity in the Lone Star and Bayou states. The bottom line? Gas production is rising in the Permian and to a lesser degree is poised to do the same in the Eagle Ford and the Haynesville as new takeaway pipelines — and, just as important, new LNG export terminals — start up. We also discussed RBN’s Arrow Model — now available for purchase — which carves the region into gas-flow “corridors,” with the green arrows in Figure 1 below showing groups of pipes that serve similar markets from comparable supply sources, the red arrows showing gas exports to Mexico, and the light- and dark-blue arrows showing LNG exports.
RBN’s Arrow Model for Texas/Louisiana Gas Flows

Figure 1. RBN’s Arrow Model for Texas/Louisiana Gas Flows. Source: RBN’s Arrow Model
We covered how the Arrow Model (1) aggregates gas production, demand and net outflows or inflows for each market area over time; (2) quantifies the degree to which gas is pushed/pulled between and among hubs, again over time; (3) anticipates gas flows on each corridor (and the need for incremental pipeline capacity); and (4) forecasts the basis differentials that underlie and support the aforementioned flows of gas. We also noted that the model gives you access to a host of relevant historical data and forecasts for gas production, pipeline flows, supply, storage, demand, regional balances and basis — month-by-month for the period from January 2022 through December 2026 as well as annual data and forecasts for the period from 2022 through 2035. (For more on what you can get, click here.)