Boom Clap – The Sound of My Netback? The Bakken Crude 2014 Roller Coaster
It’s been a big year for oil production from the Bakken formation in North Dakota with output passing the 1 MMb/d mark in April and expected to close out 2014 at 1.25 MMb/d.
Crude netbacks (market price less transport cost from the wellhead) suffered during the first half of the year from narrowing coastal price differentials - denting the economics of crude-by-rail - the most popular option to get Bakken crude to market.
Rail freight costs look set to increase in 2015 with new tank car regulations and requirements for wellhead treatment to remove volatile components.
But those changes pale into insignificance compared to the recent crude price nosedive. That threatens to reduce producer revenues by billions of dollars in 2015 and puts the spotlight on higher transport costs to get crude to market from North Dakota. Today we look at the financial impact lower netbacks could have on Bakken producers.
RBN has tracked crude production and transportation trends in the Bakken closely over the past three years - a period of rapid output growth – up 270% from 343 Mb/d in January 2011 to 935 Mb/d in January of 2014 (data from the North Dakota Pipeline Authority - NDPA). During that period of continuous growth, the greatest challenge for producers has been finding markets for their crude and securing transportation to deliver it competitively to refineries. That’s because North Dakota’s small population consumes little oil and the state is located far from large coastal refining centers.
As production took off in 2011, Midwest refinery demand for light sweet Bakken crude was quickly saturated (many Midwest refineries are configured to process heavier Canadian crude) leaving Bakken crude supplies backed up on limited pipeline infrastructure and causing an inventory glut at the Cushing, OK trading hub resulting in heavy price discounting for Bakken crudes. During 2011 and 2012 the pipeline congestion at Cushing combined with constrained pipeline take-away capacity in the Bakken encouraged a build out of rail loading terminals to deliver crude past the logjam and direct to coastal refineries (see The Year of the Tank Car). Railing Bakken crude to coastal refineries allowed the latter to take advantage of competitive prices for domestic crude versus imported alternatives (see On The Rails Again). Railroads appeared to be solving the North Dakota crude transport challenge while producers waited for slower pipeline infrastructure to be built out. And for East and West Coast markets where pipeline infrastructure seems unlikely to get built because of geography (the Rockies) or population density (East Coast) rail provided a “pipeline on wheels” to get stranded crude to refineries.
But during 2014 a good deal of rain began to fall on the Bakken crude-by-rail parade – first of all because of concerns about rail tank car safety after several fiery accidents (see The Trains They Are A Changin’) that seem likely to constrain the volume of crude moved by rail in the long run as well as raising freight and wellhead treatment costs. And second because the economics of railing crude from North Dakota to coastal markets took a hit from narrowing price differentials between midcontinent crude benchmark West Texas Intermediate (WTI) priced at Cushing, OK and coastal crudes such as Light Louisiana Sweet (LLS) at the Gulf Coast and international crude Brent, which sets the market price at the East Coast (see I Can’t Stand The Train? and Under Pressure).
When coastal crude prices were much higher than WTI it made sense to pay higher rail freight costs to ship crude to those markets. As the difference between WTI and coastal crudes narrowed, so did the incentive to use rail transport.
On the plus side for Bakken producers there was an expansion in outbound pipeline capacity from North Dakota to Cushing and to the Gulf Coast during 2014. That new capacity encouraged producers to get off the rails and to ship by pipeline. But although moving Bakken crude to the Gulf Coast by pipe is typically less expensive than railing it to East or West Coasts, crude delivered to the Gulf from North Dakota struggled to compete with booming output from the West Texas Permian and South Texas Eagle Ford basins.
Those shale crudes have less distance to travel to the Gulf Coast so their freight costs are lower. Bottom line – transport costs weigh heavier on North Dakota producers – reducing their netbacks. Producers closer to market usually make more money.
Nevertheless until the last few months of 2014 when the crude price crash began to accelerate, Bakken producers could still expect comfortable rates of return from crude prices at or close to $100/Bbl even after swallowing higher transport costs. But the price crash in the second half of 2014 (see Crying Time at OPEC?) pushed prices for WTI to as low as $55/Bbl by the end of December. If prices remain at those levels for long then rates of return for many North Dakota producers will fall to unacceptable levels with higher transport costs making matters worse.
How much damage has the crude price crash done to North Dakota crude producer’s revenues? We can’t know the real numbers yet, but to get an idea of the kind of revenue destruction that lower crude prices bring we ran the netback analysis we’ve used previously to determine the best route to market for Bakken producers (see On the Rails Again). This analysis is illustrated by Figure #1 and details the netbacks that North Dakota producers can expect from different routes to market and transport choices.
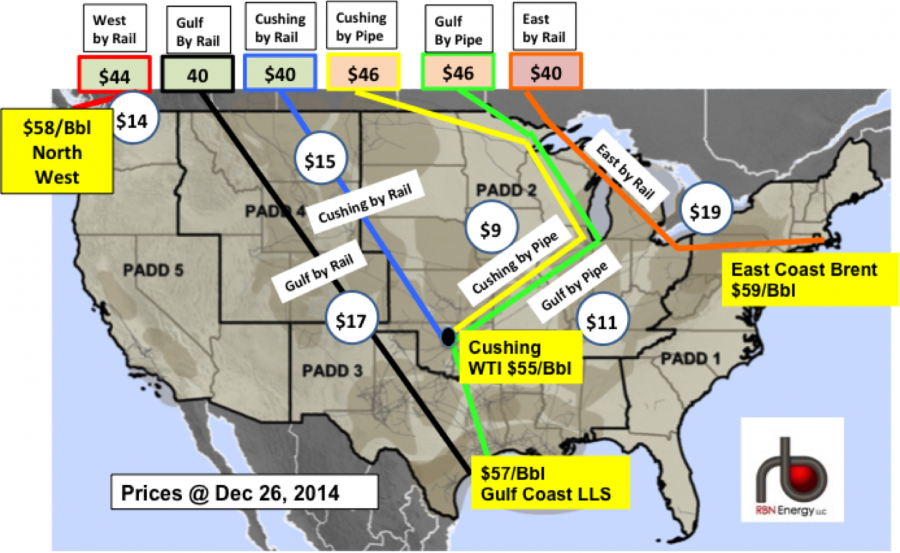
Figure #1
Source: RBN Energy, Market data from Morningstar (Click to Enlarge)
The map in Figure #1 shows North Dakota producer netbacks based on prices for December 26, 2014. The various routes and modes of transport from North Dakota to the West Coast, East Coast, Gulf Coast and Cushing, OK are shown with different color lines.
In a minute we compare these netbacks with the averages for 2013. First a more detailed explanation of the netback analysis in Figure #1. Bakken producer netbacks are shown along the top of the map and represent the crude market price at the destination less the freight costs for each route as shown in the white circles. These freight costs are based on a number of industry presentations as well as published pipeline tariffs, terminal rates and estimates of rail car leases. The cost estimates include all transportation from the wellhead to the refining region and are by their nature representative rather than actual. The yellow text boxes indicate the market regional price in $/Bbl.
The numbers you see here represent market pricing for December 26, 2014 when WTI at Cushing was $55/Bbl, LLS at the Gulf Coast $57/Bbl, Brent (East Coast pricing) was $59/Bbl and ANS (West Coast) was $58/Bbl. Looking at the boxes along the top of the map, you can see that the highest netback is $46/Bbl and that two routes have that netback – Cushing and the Gulf Coast by pipeline. Next behind the two pipeline routes comes the Pacific North West route with a $44/Bbl netback, followed by the Cushing, Gulf Coast and East Coast rail routes – all with $40/Bbl. In summary – as of December 26, Bakken producers could expect netbacks in the $40 - $46/Bbl range with higher rail costs to the East Coast cutting that netback to $40/Bbl. [Note producers that have hedging programs will be achieving higher netbacks than these because their hedges compensate them in case of lower market crude prices – but typical hedging programs only extend out for 2015 so they will not be protected forever.]
How do these returns compare to previous netbacks for Bakken producers? Table #1 shows both the results for December 26, 2014 and average values calculated for the year 2013 on the same cost basis. Along the top of the table are the different route options. Below are two rows showing different netbacks. The first row is the arithmetic mean of the market destination prices for 2013 less the same representative freight costs used in Figure #1. The second row is a summary of the results for December 26, 2014 shown in Figure #1.
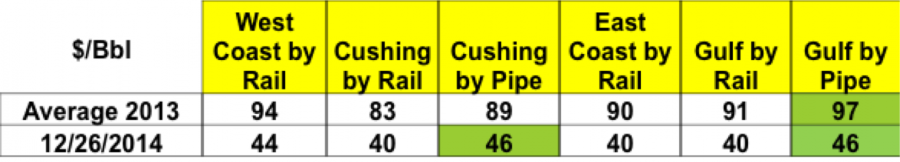
Table #1
Source: RBN Energy (Click to Enlarge)
Row 1 in Table #1 shows that in 2013 as a whole, the Gulf Coast by pipeline route provided the best netback for producers (green shaded cell). Note that there was little available pipeline capacity to get to the Gulf Coast during 2013 so most producers would not have achieved that higher netback. You can see from row 1 in the table that rail options to the West Coast, East Coast and Gulf Coast all produced average netbacks over $90/Bbl during 2013. And if you compare rows 1 and 2 you see that the 2013 numbers are all double the recent values in row 2 - (except for Cushing by pipe that is under by a hair). This tells us that the price crash has halved producers crude netback revenues compared to 2013.
Next we made a guestimate of the total impact of the price crash for Bakken producer netback revenue. In 2013, the NDPA reported North Dakota crude production at roughly 314 MMBbl for the year. The average 2013 netback from row 1 in Table #1 is $91/Bbl meaning that North Dakota netback revenue for the year would have been about (314 million * $91) or $29 Billion. We then compared that number against 2014 production volumes that we estimate should come out close to 399 MMBbl. First we took an average of netbacks over 2014 (though December 26) calculated the same way as for 2013 – about $83/Bbl – meaning that estimated 2014 netback revenue is 399 million * $83 or $33 Billion. In other words, based on the netbacks, producers will get $4 Billion more netback revenue in 2014 than 2013 – not surprising given higher production and high crude prices earlier in the year. Second we estimated what kind of dent a full year at recent prices would have made to that $33 Billion 2014 expected revenue. To do this we multiplied 2014 expected production of 399 MMBbl by the arithmetic mean of our December 26, 2014 netbacks from Table #1 ($43/Bbl).
The result is 399 million * 43 or $17 Billion - so here’s the sobering bottom line – North Dakota producer netback revenue for 2014 would have been about $16 Billion lower at current prices. So while we reiterate that this is ballpark math that $16 Billion sure represents a big hole in producer netback revenue and it gives a pretty good idea of how much impact a 50 % drop in oil prices has on producer revenues.
Certainly enough to cause careful reconsideration of 2015 drilling budgets and close scrutiny of production costs and break-even estimates for new wells. And in that cost-conscious environment, higher transportation costs will weigh heavy on rates of return - leaving the Bakken more vulnerable than other basins closer to market.
In the next couple of weeks we will dig into more specific break-even analysis for U.S. shale productions by region – including transport costs estimates such as those we highlighted in this analysis.