Locator: 48355B.
Google: yardeni I'm usually bullish and i'm usually right.
Wow, wow, wow: scrolling through my twitter feed -- incredible stories. I won't get them all posted, but some incredible stuff.
Top story of the day: US takes gold / bronze in men's 1500-meter race. YouTube: hocker.
Next up: Walz -- breath of fresh air. I'm having second thoughts -- Vance / Trump may have met their match winning hearts and minds of voters. We'll see.
Aviation: no signs of recession here. Did "we" just get played this past week. If so, not complaining. Great, great buying opportunities.
Pet peeve -- selective reporting. Folks upset with Nancy Pelosi fail to follow through with rest of the story:

Ticker:

*********************************
Back to the Bakken
WTI: $74.55. Up almost 2% overnight.
Thursday, August 8, 2024: 19 for the month; 75 for the quarter, 401 for the year
40236, conf, Iron Oil Operating, Stocke 5-4-9H,
39602, conf, Hess, BL-iverson B-155-95-0807H-7,
None.
RBN Energy: Gulf coast export terminals vie for NGL and crude oil market share. Archived.
Over the past decade, the only significant growth market for U.S. crude oil and NGLs has been exports, with over 90% departing from the Gulf Coast. Exports via Gulf of Mexico ports have surged from about 1 MMb/d in 2016 to over 6 MMb/d last year. Great news for PADD 3 export facilities, right? Well, it’s not that simple. The distribution of barrels has been wildly uneven, resulting in significant winners, forlorn losers, and everything in between. And export volumes are still ramping up, as is the competition among marine terminals for crude and NGL export market share, with far-reaching consequences for producers, midstreamers and exporters. This is one of the core themes at our upcoming NACON conference, which is all about PADD 3 North American Crude Oil & NGLs and scheduled for October 24 at the Royal Sonesta Hotel in Houston. In today’s RBN blog, we’ll delve into the highly competitive liquids export landscape, consider some of the important factors driving flows one way or the other, and — fair warning — slip in some subliminal advertising for the NACON event.
It's a highly competitive market out there. For PADD 3 crude oil exports, Corpus Christi has dominated the scene for the past five years, but the Houston area is mounting a strong comeback. In fact, Houston could reclaim the lead if one of the deepwater offshore projects gets built. Today, Houston is out front in LPG exports, but Port Arthur/Nederland has been challenging this position — and Houston’s now fighting back with the announcement of a new Enterprise expansion on the Houston Ship Channel. For ethane, it sure looks like Port Arthur/Nederland is gaining the upper hand, with an Energy Transfer expansion and the new Enterprise Neches River flex facility in the works. Meanwhile, new greenfield proposals continue to be confidentially floated, potentially disrupting the market landscape.
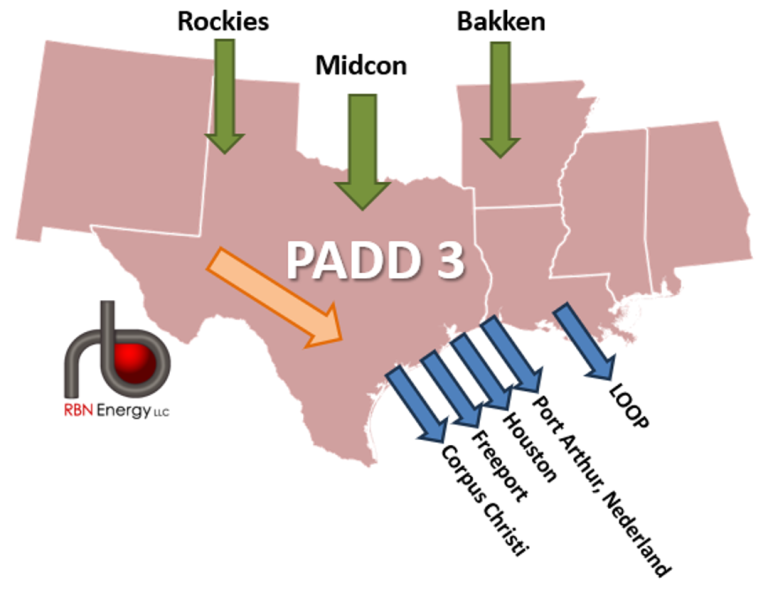
What’s fueling this beehive of competitive activity? To make sense of what’s going on, let's start at the beginning. What exactly do we mean by PADD 3 exports? As shown in the stylized and simplified Figure 1 graphic of our PADD 3 model, crude oil and Y-grade NGLs flow into the region from the Rockies, the Midcontinent and the Bakken (green arrows). These barrels merge with PADD 3 production, primarily from the Permian and Eagle Ford (orange arrow), before being transported to export markets. About 90% of the growth in U.S. liquids production over the past decade moves along these corridors and is exported from one of five port locations: Corpus Christi, Freeport, Houston, Port Arthur/Nederland, and LOOP (blue arrows). NGLs are exported from the Texas ports, while crude oil is shipped from all ports except Freeport. However, there is a significant disparity in the distribution of barrels among these ports. We’ll get back to the magnitude and reasons for the unequal allocation of export volumes in a minute.

Figure 1. PADD 3 Crude and NGL Inflows/Outflows. Source: RBN