For now, I will just copy and paste what the reader wrote. Hopefully you will find it as fascinating as I did. Hopefully the reader does not mind that I took this route. If the reader wants it removed, just let me know.
From a reader:
Thursday last week you posted a link to an RBN Energy article titled Gas Storage Inventories Are Near Historic Lows. What If This Winter Turns
Frigid?” .. there was a graph in
that article i found interesting and pulled out to annotate and use for
my own blogs...i had intended to give you the 30 second version in a
comment, but since i'm emailing you, i'll just include the whole thing
(red markings mine):
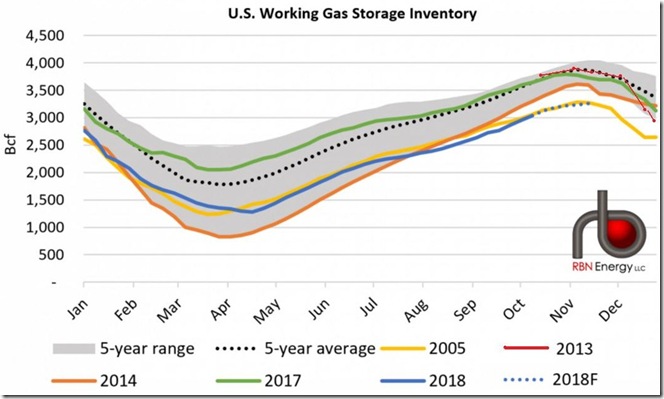
According to most tellings, the natural gas injection season traditionally ends with the first weekend of November, after which natural gas inventories typically begin to fall, as increasing amounts of natural gas are pulled from storage for heating as temperatures fall heading into winter…in fact, however, we find that the recent history of natural gas storage (xls) shows that there have actually been increases in natural gas supplies during the first full week of November in 4 out of the last 8 years, so we have to consider that might be possible again this year…either way, we can only expect a few more weeks of increases before natural gas supplies peak before winter and start downhill…to assess where we now stand as compared to other years when prewinter supplies were low, we’re going to include a graph from RBN energy that shows US natural gas storage history for a few of those key years as compared to last year and the five year history..
The above graph comes from the RBN Energy analytical post titled “Colder Weather – Gas Storage Inventories Are Near Historic Lows. What If This Winter Turns Frigid?” and as published it shows the natural gas storage history for 2005 in billions of cubic feet in yellow, for 2014 in orange, for 2017 in green, and natural gas storage for 2018 year to date in blue.
It also shows as blue dots what is presumably the EIA forecast for what appears to be the last 4 weeks of the injection season, which would include a forecast for this week’s report that we just covered, since the cited RBN post was published on October 24, the day before this weeks natural gas storage report was released.
Also shown in a grey shaded area above is the 5 year range of natural gas in storage for any given date during the year, and then the average amount of natural gas in storage for any given date during those 5 years is shown by a grey dotted line.
Finally, as an addition to the original graph, in red I have penciled in the amount of natural gas storage for the last 11 weeks of 2013, reasons for which i’ll explain shortly…
So to begin with the obvious, this year’s natural gas storage levels in blue have been well below 2017’s gas in storage in green and the 5 year average in grey dots; over recent weeks it has also been below the 5 year range, and below the amount of gas stored during 2014, which was prior to this year the lowest level in over a decade.
But as you can also see, this year’s natural gas in storage has tracked pretty close to the level of 2005 (yellow), the lowest in 13 years ...
So with that, we’ll look at the actual amounts of gas in storage from the historical natural gas storage archive files (xls)...
As we mentioned earlier, our natural gas supplies had risen to 3,095 billion cubic feet by October 19th of this year; that would compare with the 3,139 billion cubic feet of natural gas that were in storage on October 21st of 2005, so we are pretty close to that level…
First point: However, after rising to 3,229 billion cubic feet on November 4th, 2005, the EIA’s presumable end of season comparison, natural gas supplies went on to peak at 3,282 billion cubic feet on November 11th, 2005, a 57 billion cubic feet increase during the 2nd week of November, which is one of the largest if not the largest increase that late in the year…so while we may match 2005 storage levels on November 2nd of this year, it seems highly unlikely that we’d match 2005’s November 11th high after that…
Now, the last thing I want to note on that graph is the 2014 natural gas storage levels…that’s the winter we were hit with repeated outbreaks of “the polar vortex”, and as a result our natural gas supplies fell to a low of 824 billion cubic feet by March 28th of that year, the lowest in the modern records, and stayed at 5 year lows throughout the summer until December of that year…so to compare supplies going into this coming winter to that of 2014, we’d have to go back to the fall of 2013, which is why i penciled in those dots and red line on this graph…
... on October 18th, 2013, US natural gas supplies were at 3,741 billion cubic feet, and they rose to a high of 3,834 billion cubic feet three weeks later on November 8th….which leads us to our ....
Second point: With our recent October 19th supplies at 3,095 billion cubic feet, that means that if our natural gas usage this winter is similar to that of 2014, our natural gas supplies would fall to just 178 billion cubic feet by the end of the heating season…that would certainly imply widespread natural gas shortages, and answer the question that the RBN post didn’t, i.e., What If This Winter Turns Frigid?

