Locator: 48400B.
US oil production: sets new all-time January record; twelfth consecutive month above 13.1 million bopd, field production. Link here.
Shale: agree 1,000%. Brilliant insight. Link here. The question is whether the Bakken revolution is being driven by economics or geology. Obviously it's a bit of both, but if push comes to shove, economics will win out in the short term. That is, price WTI at $100 and let's see what shale does.

********************************
Back to the Bakken
WTI: $71.49. Whoo-hoo. Up 3.07%. Up $2.13 / bbl.
New wells:
- Tuesday, April 1, 2025: 3 for the month, 3 for the quarter, 200 for the year,
- 41186, conf, Murex, LA-Emma Rose 30-31H LE MB,
- 40154, conf, Hess, EN-Engebretson-157-94-1003H-4,
- 39320, conf, Grayson Mill, Marilyn 31-33 4H,
- Monday, March 31, 2025: 86 for the month, 197 for the quarter, 197 for the year,
- None.
- Sunday, March 30, 2025: 86 for the month, 197 for the quarter, 197 for the year,
- 41131, conf, Murex, LA-Riley Kyle 25-36H MB,
- 40155, conf, Hess, EN-Schroeder-157-94-1102H-2,
- 39693, conf, Hess, TI-Beauty Valley-158-95-1423H-6,
- Saturday, March 29, 2025: 83 for the month, 194 for the quarter, 194 for the year,
- 41020, conf, CLR, Alfsvaag Federal 7-31H,
- 40857, conf, BR, West Kellogg 4A UTFH-B,
RBN Energy: new natural gas pipes and LNG terminals shake up Texas / Louisiana gulf coast. Archived.
Over the next couple of years, six new pipelines and expansion projects will bring 11.8 Bcf/d of incremental natural gas supplies to the Texas/Louisiana Gulf Coast. During the same period, more than 8 Bcf/d of new LNG export capacity will move that gas to international markets. The impact of this onslaught of gas flows will be anything but orderly. Inflows will never equal outflows. Pipes will arrive early with supplies, with LNG terminals coming along later. Gas flows will shift from west to east, and north to south, in chaotic patterns that will upend historical price relationships. Is there any way to make sense of all this? There sure is, as we discuss in today’s RBN blog. All you need is the right arrow pointing the way.
Fast-rising gas production in the Permian, growth potential in the Haynesville and Eagle Ford, and the rapid buildout of new gas pipelines and LNG export capacity make this a particularly exciting — and challenging — time for gas market players in Texas and Louisiana. One thing is clear: With so much going on, it’s never been more important to have a solid understanding of how the market will evolve, month by month and year by year, as all this new infrastructure comes online. Why? Because the new pipeline capacity and liquefaction trains will have continually changing impacts not only on gas flows throughout the two-state region but on gas basis at every hub.
With all that in mind, RBN has developed — and now made available for our subscription customers — the Arrow Model, which (1) aggregates gas production, demand and net outflows or inflows for each market hub over time; (2) quantifies the degree to which gas is pushed/pulled between and among hubs, again over time; (3) anticipates gas flows on each corridor (and the need for incremental pipeline capacity); and (4) forecasts the basis differentials that underlie and support the aforementioned flows of gas.
We’ll get to the details in a moment, but first a quick summary of where things stand today — and how much things will change over the next two years or so. Permian gas production exceeds 21 Bcf/d, Haynesville and Eagle Ford E&Ps are poised to increase their output, and new pipelines (and pipeline expansions) from production areas to the Gulf Coast (and along the coast) are in the works, including the 2.5-Bcf/d Blackcomb Pipeline (dashed red-and-black line in Figure 1 below) from Waha to Agua Dulce, the 1.5-Bcf/d Hugh Brinson Pipeline (dashed blue-and-black line) from Waha to the Dallas/Fort Worth area, and the 1.5-Bcf/d Trident Pipeline (dashed orange-and-black line) from the Katy, TX, hub to Sabine Pass. And that’s just the supply side of the equation. After a pause in LNG capacity additions last year, Plaquemines LNG is increasing its output and several new LNG export projects are slated to come online, starting with Corpus Christi LNG Stage III (the first element of which is already sending out LNG) and followed in short order by Golden Pass LNG (Sabine Pass), Rio Grande LNG (Brownsville, TX) and Port Arthur LNG (see dash-bordered diamonds). These projects will add 6.9 Bcf/d of gas demand by mid-2027 and another 4.1 Bcf/d by 2030, dramatically altering regional gas flows as they do.
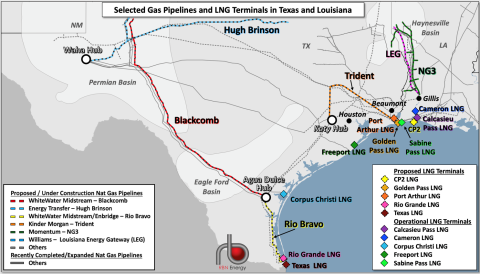
Figure 1. Selected Gas Pipelines and LNG Terminals in Texas and Louisiana. Source: RBN
