Locator: 50583B.
BRK: looks like BRKB will have another miserable day.
Gates: as in Bill Gates. Legacy in tatters? Melinda knows. Gates Foundation gutted. Buffett walked away a long time ago. Link here. Will testify June 10, 2026.
Energy: link here.

********************************
Back to the Bakken
WTI: $90.28.
New wells reporting:
- Wednesday, April 22, 2026: 71 for the month, 71 for the quarter, 228 for the year,
- 41791, conf, XTO, GBU Apollo 14X-12D-S,
- 41380, conf, Enerplus, Hamilton 146-97-35-26-8H-ELL,
- 41103, conf, Enerplus, Hamilton 146-97-35-26-7H,
- 41102, conf, Enerplus, Hamilton 146-97-35-26-6H,
- 41101, conf, Enerplus, Hamilton 146-97-35-26-5H,
- 40793, conf, Hess, GO-Seaton-156-98-0607H-3,
- Tuesday, April 21, 2026: 65 for the month, 65 for the quarter, 222 for the year,
- 41790, conf, XTO, GBU Apollo 14X-12G-S
- 41789, conf, XTO, GBU Apollo 14X-12H-S,
RBN Energy: organic oil and gas reserve replacement continues to dip on conservative investment. Link here. Archived.
Energy industry cheerleaders tout vast supplies of untapped U.S. oil and gas resources, but increasingly limited volumes that can be practically and profitably developed — and their desire to follow a cash-return model — have left producers struggling to organically replace proven reserves. The percentage of hydrocarbon production replaced through finding and developing has been cascading since 2018 and dipped below 100% in 2025 for the first time in more than a decade. In today’s RBN blog, we’ll review 2025 U.S. E&P reserve reporting and analyze the trends that are limiting the industry’s ability to ramp up future output.
First, let’s define oil and gas reserves and review how producers report them. Proved reserves are quantities of crude oil, natural gas and NGLs assumed to have at least a 90% chance of eventual recovery under existing economic and operating conditions (see Square One). In contrast, probable reserves have a 50% chance of technical and economic recovery, while possible reserves have only a 10% chance of recovery. Oil and gas companies are mandated to report their proved reserves in their annual Form 10-K’s. The changes result from four factors:
- Extensions and discoveries, the most impactful, are reserves unlocked through the development of existing fields and the successful exploration of new properties. These additions are funded by the company’s annual organic — or finding and development (F&D) — capital spending. The level and effectiveness of this investment is critical to the long-term sustainability of an E&P.
- Revisions of previous estimates generally result from changes in commodity prices — lower prices can make certain volumes uneconomic to produce, while higher realizations nudge volumes into the proved category. Poor or better-than-expected well performance can also change estimates of future recoverable volumes from a field.
- Purchases and divestitures reflect the net result of M&A activity.
- Production volumes are subtracted from beginning-of-year reserves and current-year reserve additions to arrive at current year-end reserves.
The key measures of the quality and long-term sustainability of a company’s oil and gas properties are the costs incurred in organically replacing reserves through extensions and discoveries — see the first bullet above. These include development activities, such as drilling and completing wells, adding infrastructure such as roads and processing facilities, water handling and disposal, and other expenses. They also include exploration costs for finding new oil and gas reserves. What producers call the F&D replacement rate is calculated by dividing their total organic reserve additions by their total production. F&D costs are calculated by dividing the total exploration and development costs by the volume of organic reserve additions.
As shown in Figure 1 below, reserve F&D replacement rates (orange line and right axis) declined from a high of 228% in 2018 to just 93% in 2025. The steep fall from the peak resulted from sharp cutbacks in organic capital investment as oil prices plummeted in late 2019 and cratered with the onset of the pandemic in early 2020. The rate temporarily rose on catch-up activity in 2021 but has fallen since. At the same time, F&D costs (blue bars and left axis) nearly doubled from the $6/boe range in 2016-21 to about $12/boe in 2023-25.
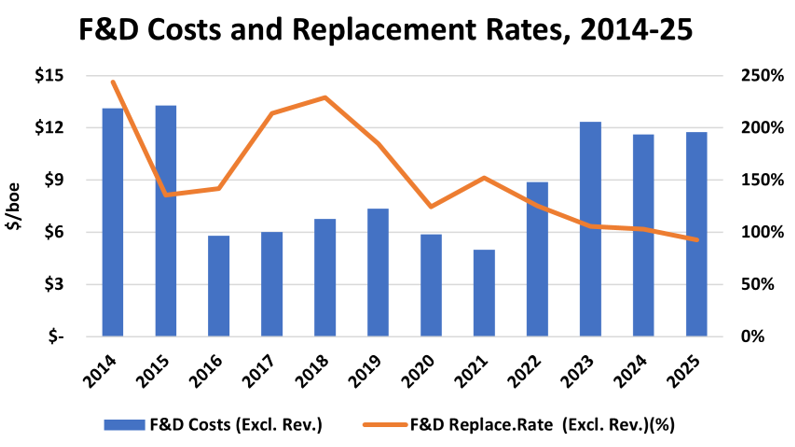
Figure 1. F&D Costs and Replacement Rates, 2014-25. Source: Oil & Gas Financial Analytics LLC