- US crude oil inventories decreased by a meaningful 3.3 million bbls, considering that a record amount was also released from the SPR last month.
- US crude oil inventories now stand at 421.7 million bbls; 6% below the five-year average.
- US imports .. yawn.
- US refiners operating at 93.8% of their operable capacity as we wind down the US driving season. Diesel is the big issue.
- Distillate fuel inventories decreased by 0.7 million bbls; remains 24% below the five-year average.
- Jet fuel supplied was up 7.3% compared with same four-week period last year.
After the report:
- WTI: down slightly after report;
- at 10:10 a.m. CT -- back up almost 1%; up 76 cents; trading at $94.50.
- naural gas: down half a percent
- gasoline: down 3.5%
Gasoline demand: pending, later today.
***************************
Back to the Bakken
The Far Side: link here.
WTI: surprise, surprise, now, mid-morning, WTI is up over 1%; over over a $1; trading over $94.76.
Natural gas: $9.167.
Active rigs: 45.
Thursday, August 25, 2022: 17 for the month, 48 for the quarter, 387 for the year
- 38368, conf, CLR, Fuller Federal 2-2HSL1,
- 38005, conf, Hess, CA-E Burdick-155-95-2932H-6,
- 36641, conf, Hess, BL-S Ramberg-155-95-0601H-6,
Wednesday, August 24, 2022: 14 for the month, 45 for the quarter, 384 for the year
- None.
RBN Energy: E&Ps bask in soaring second-quarter profits on surging gas and oil prices.
Gas-weighted E&Ps 2Q22 results.
Oil-weighted E&Ps 2Q22 results.
Out of the long, brutal struggles to create a British nation in the Medieval Ages arose the legend of Camelot, an idyllic kingdom that for a “brief shining moment” enabled its inhabitants to bask in peace and prosperity. In the second quarter of 2022, U.S. oil and gas producers that had, for the last two decades, been roiled with severe price volatility, recession, environmental pressures, investor hostility and a pandemic, finally found their Camelot. Rising oil prices and surging natural gas realizations drove per-unit revenues to a 15-year high, and nearly nine out of 10 of the incremental dollars fell straight to the bottom line as producers successfully wrangled inflation to keep costs under control. The result was E&P coffers overflowing with record earnings and cash flows. However, Camelot, in the words of the 1960 musical, was “a fleeting wisp of glory,” and clouds are emerging on the horizon for U.S. E&Ps in the third quarter. In today’s RBN blog, we catalog Q2 2022 results and preview the issues that could impact third-quarter earnings.
First, let’s look at commodity prices. Rising crude oil prices have dominated the headlines this year, and the WTI spot price peaked in Q2 2022 at $108/bbl — 15% higher than the previous quarter, 65% higher than the year-ago quarter, and the highest since Q2 2008.
And gas producers, which had been struggling with tepid prices for most of the last decade and a half, were finally rewarded with surging realizations.
The Henry Hub spot price broke through the $6.00/MMBtu barrier in April for the first time since November 2008 and soared to average $7.52/MMBtu for the quarter. This represented a 52% increase over the previous quarter and a 150% boost over the year-ago period.
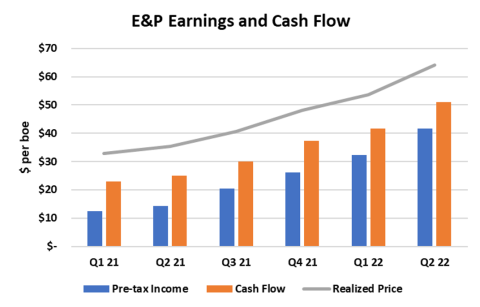
These rising prices produced glittering Q2 2022 numbers. As shown in Figure 1 below, the 42 E&P companies we monitor posted record pre-tax operating profits of $52.8 billion ($41.56 per barrel of oil equivalent, or boe) in the April-through-June period and record cash flow of $64.8 billion ($51.11/boe).
On a per-unit base, earnings were $9.27/boe (29%) higher than the previous quarter and nearly triple the Q2 2021 results.
Cash flows rose by $9.42/boe, or 22%, from Q1 2022 and were more than double the $24.97/boe recorded in the year-ago quarter. First-half 2022 earnings were nearly $7 billion higher than full-year 2021 results, and the $52.8 billion in Q2 2022 profits exceeded the total amount earned for all of 2014, when oil prices last exceeded $100/bbl. Company cash flows are on pace to surpass $200 billion for all of 2022.
Figure 1. Oil & Gas Upstream Earnings and Cash Flow Q1 2021 - Q2 2022. Source: Oil & Gas Financial Analytics, LLC
Realized prices (gray line in Figure 1) were $64.10/boe — $10.52/boe, or 19%, higher than the $53.58/boe posted in Q1 2022 and $28.83/boe, or 82%, higher than the period a year earlier. Per-unit revenues in Q2 were 26% higher than 2014, the highest year in the last two decades.
As we said in our intro, nearly nine out of 10 of those extra dollars flowed directly to the bottom line as cost increases have been modest to date. Total per-unit costs were 6% higher than the previous quarter and 7% higher than the year-ago period. Lifting costs were up by $1.10/boe, or 9%, with the bulk of the increase driven by price-related production taxes. This was slightly offset by lower non-cash costs.
The 16 oil-weighted E&Ps we track posted the highest profit of our three peer groups in Q2 2022 at $20.9 billion ($49.12/boe), edging out the 15-company Diversified E&P group with $19 billion ($46.64/boe) and soundly outperforming the 11-company Gas-Weighted E&Ps at $12.8 billion ($29.38/boe).
ConocoPhillips posted the highest earnings and cash flow of our 42 E&Ps at $7.2 billion and $9.2 billion, respectively.
On a per-unit basis, HighPeak Energy, a Midland Basin producer, led the pack with profit and cash flow at $70.18/boe and $87.70/boe, respectively. Oil and gas production by our universe of E&Ps grew 4% over Q1 2022 and 11% over Q2 2021 to 1.269 billion boe.
Production volume increases have been highly influenced by acquisition activity. ConocoPhillips was the largest producer we follow at nearly 154 MMboe, about 50 MMboe more than Occidental Petroleum, its nearest competitor.
Much more at the link. The article is archived.
